Case Study 7
2023.10.24 22:48 pm Hong Kong time.
The key here is that this is NOT a similar trend reversal, as the Nasdaq index has NOT been rising Continuously for a long time and then fall a short time, then to reverse the trend. It has been up and then down (not continuously up) from July to now ! So it does not confirm a trend reversal by Oct. 26.
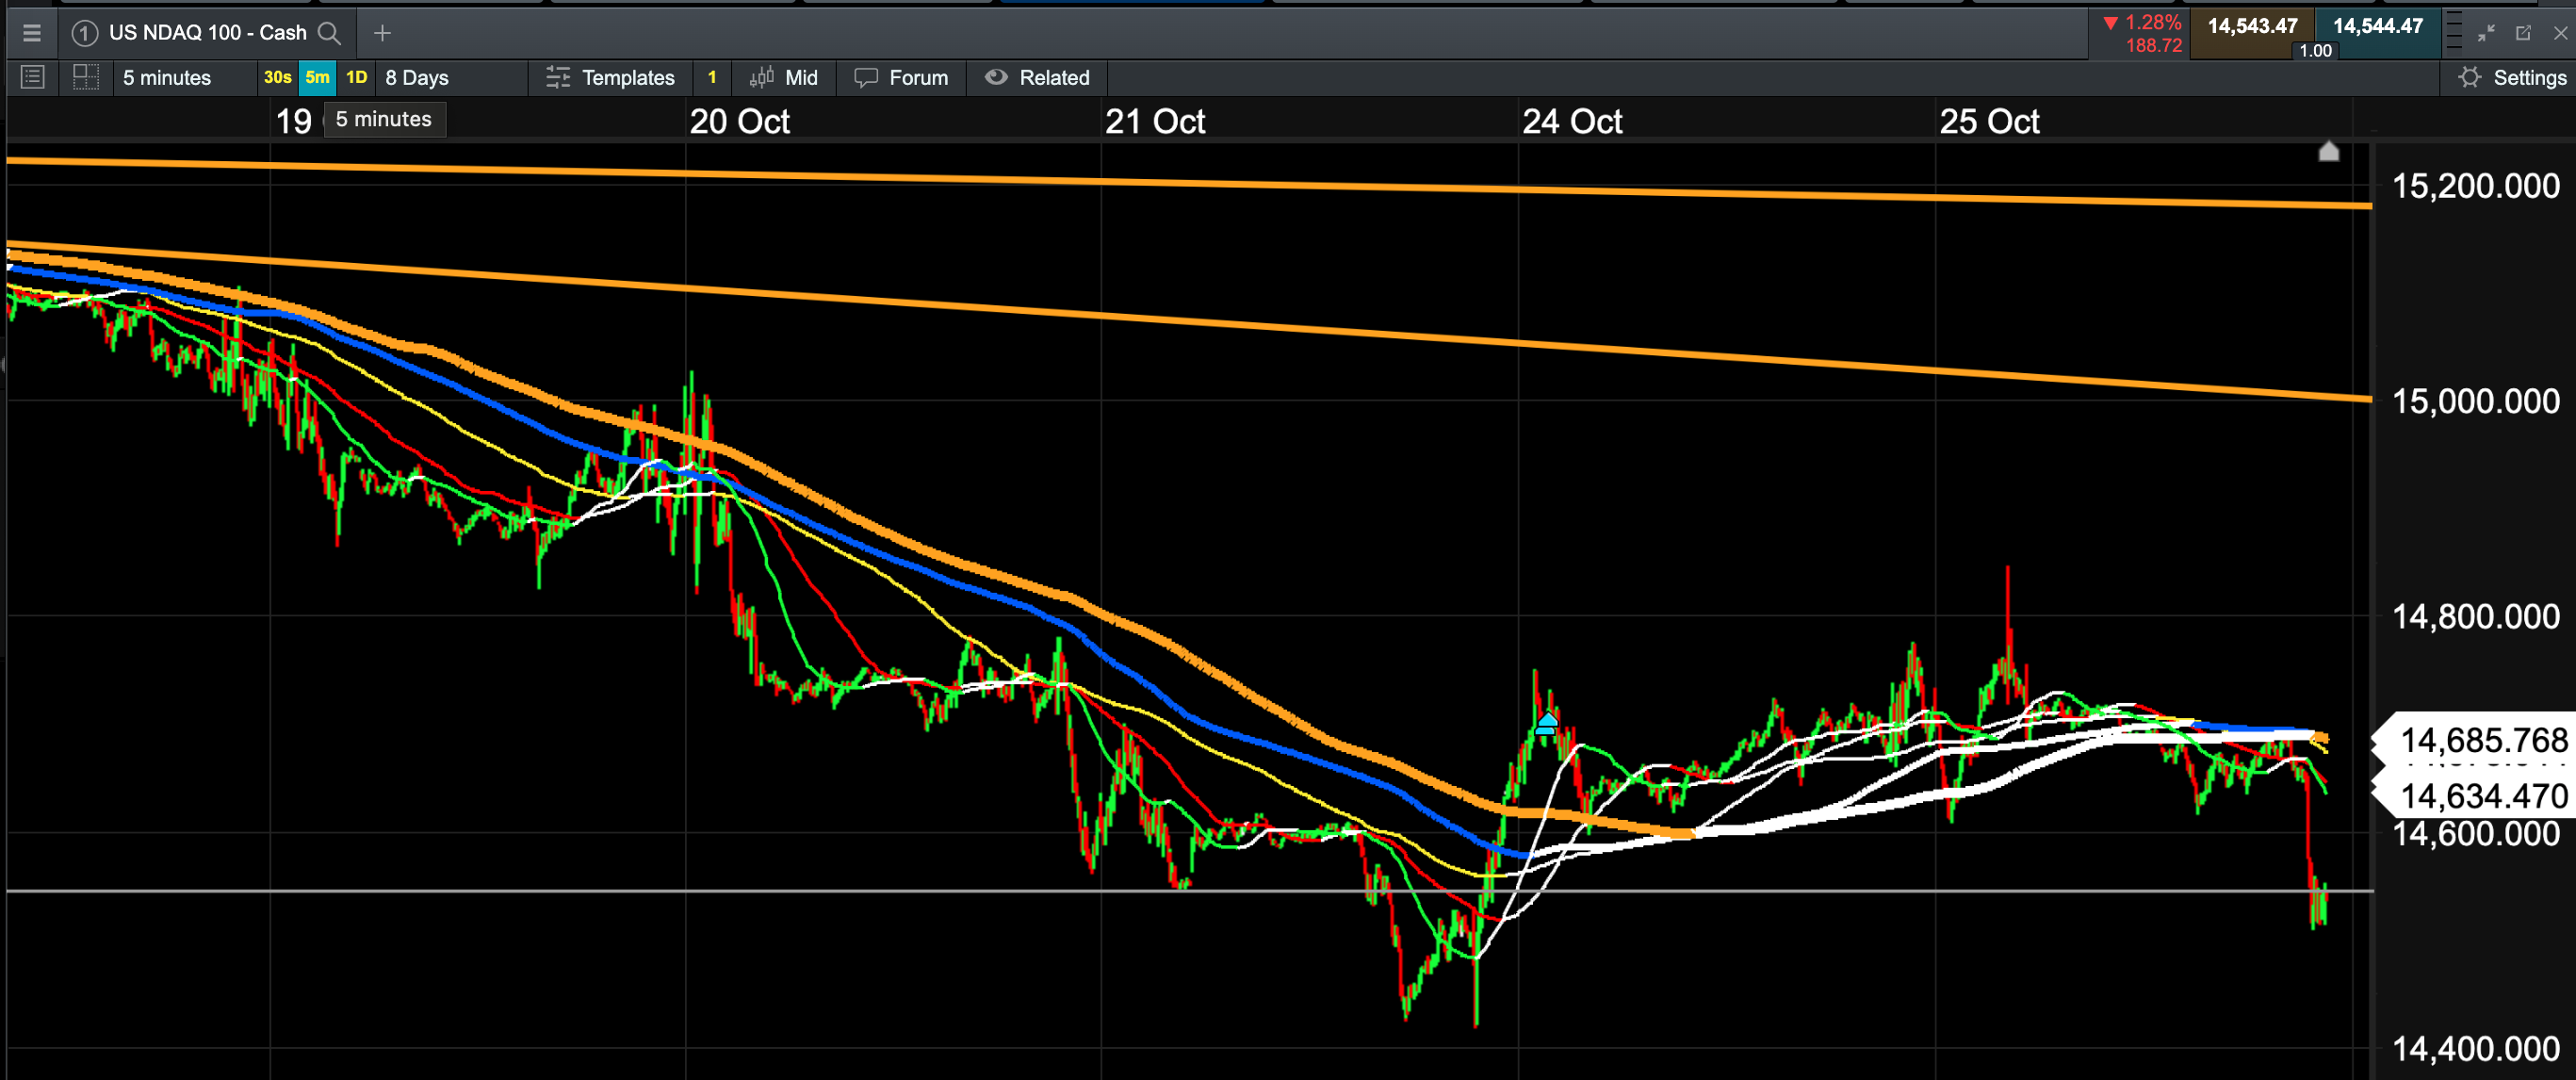
Nasdaq (and almost all markets) have been dropping over the past weeks, until yesterday, the short 8-day chart looks like below, and showing a reversal signal:
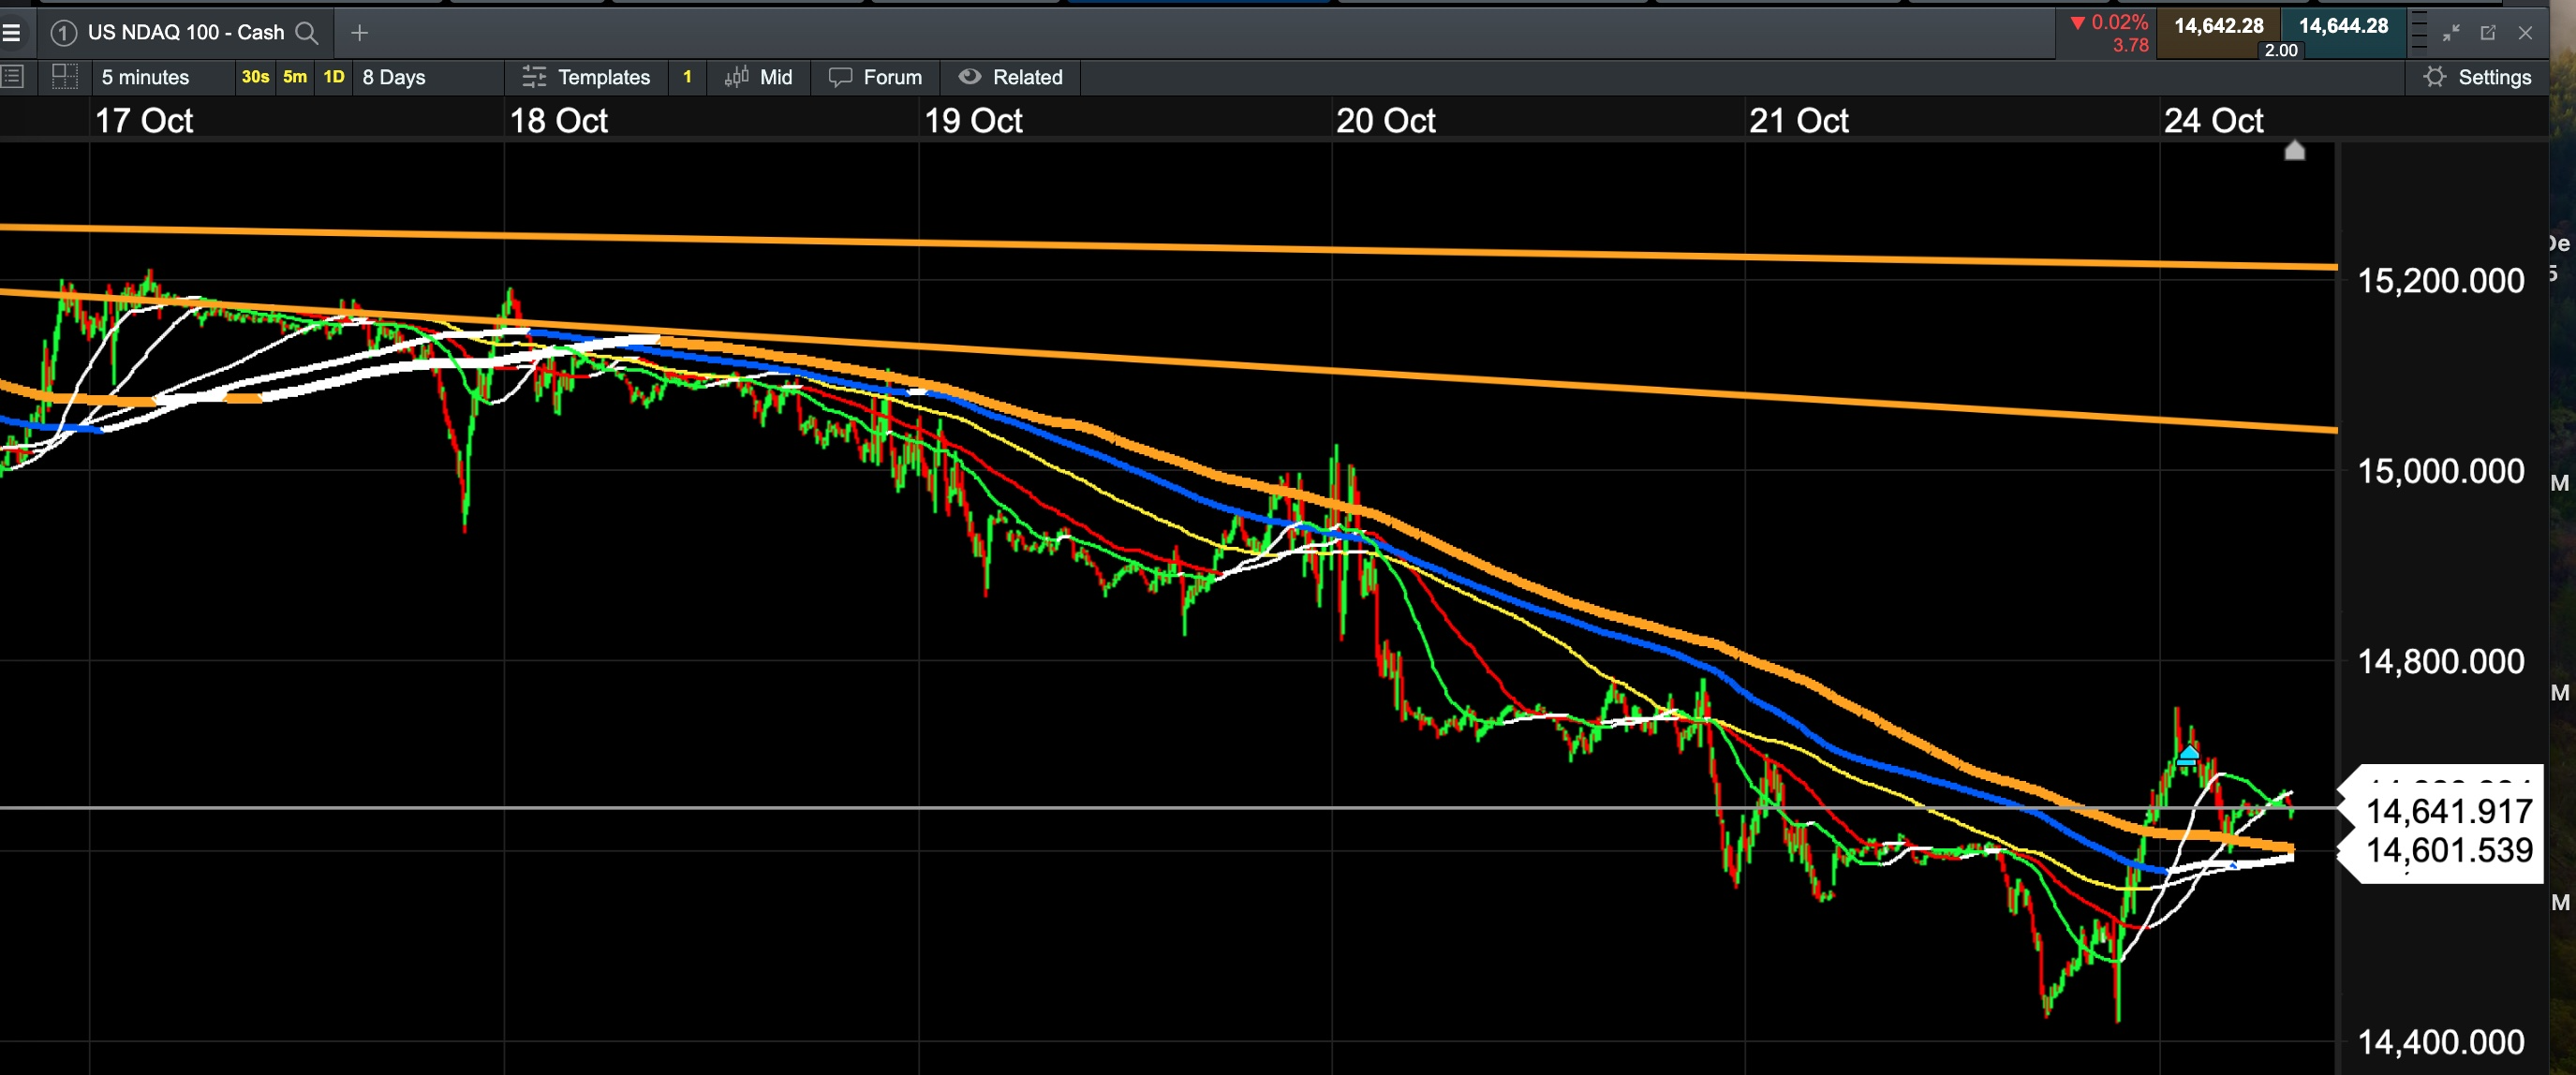
So I bought 2 longs as the 2 blue triangles shown in the graph .
One day later , the chart looks like this (hours before market is open):

After the market is open, the market jumps and drops :
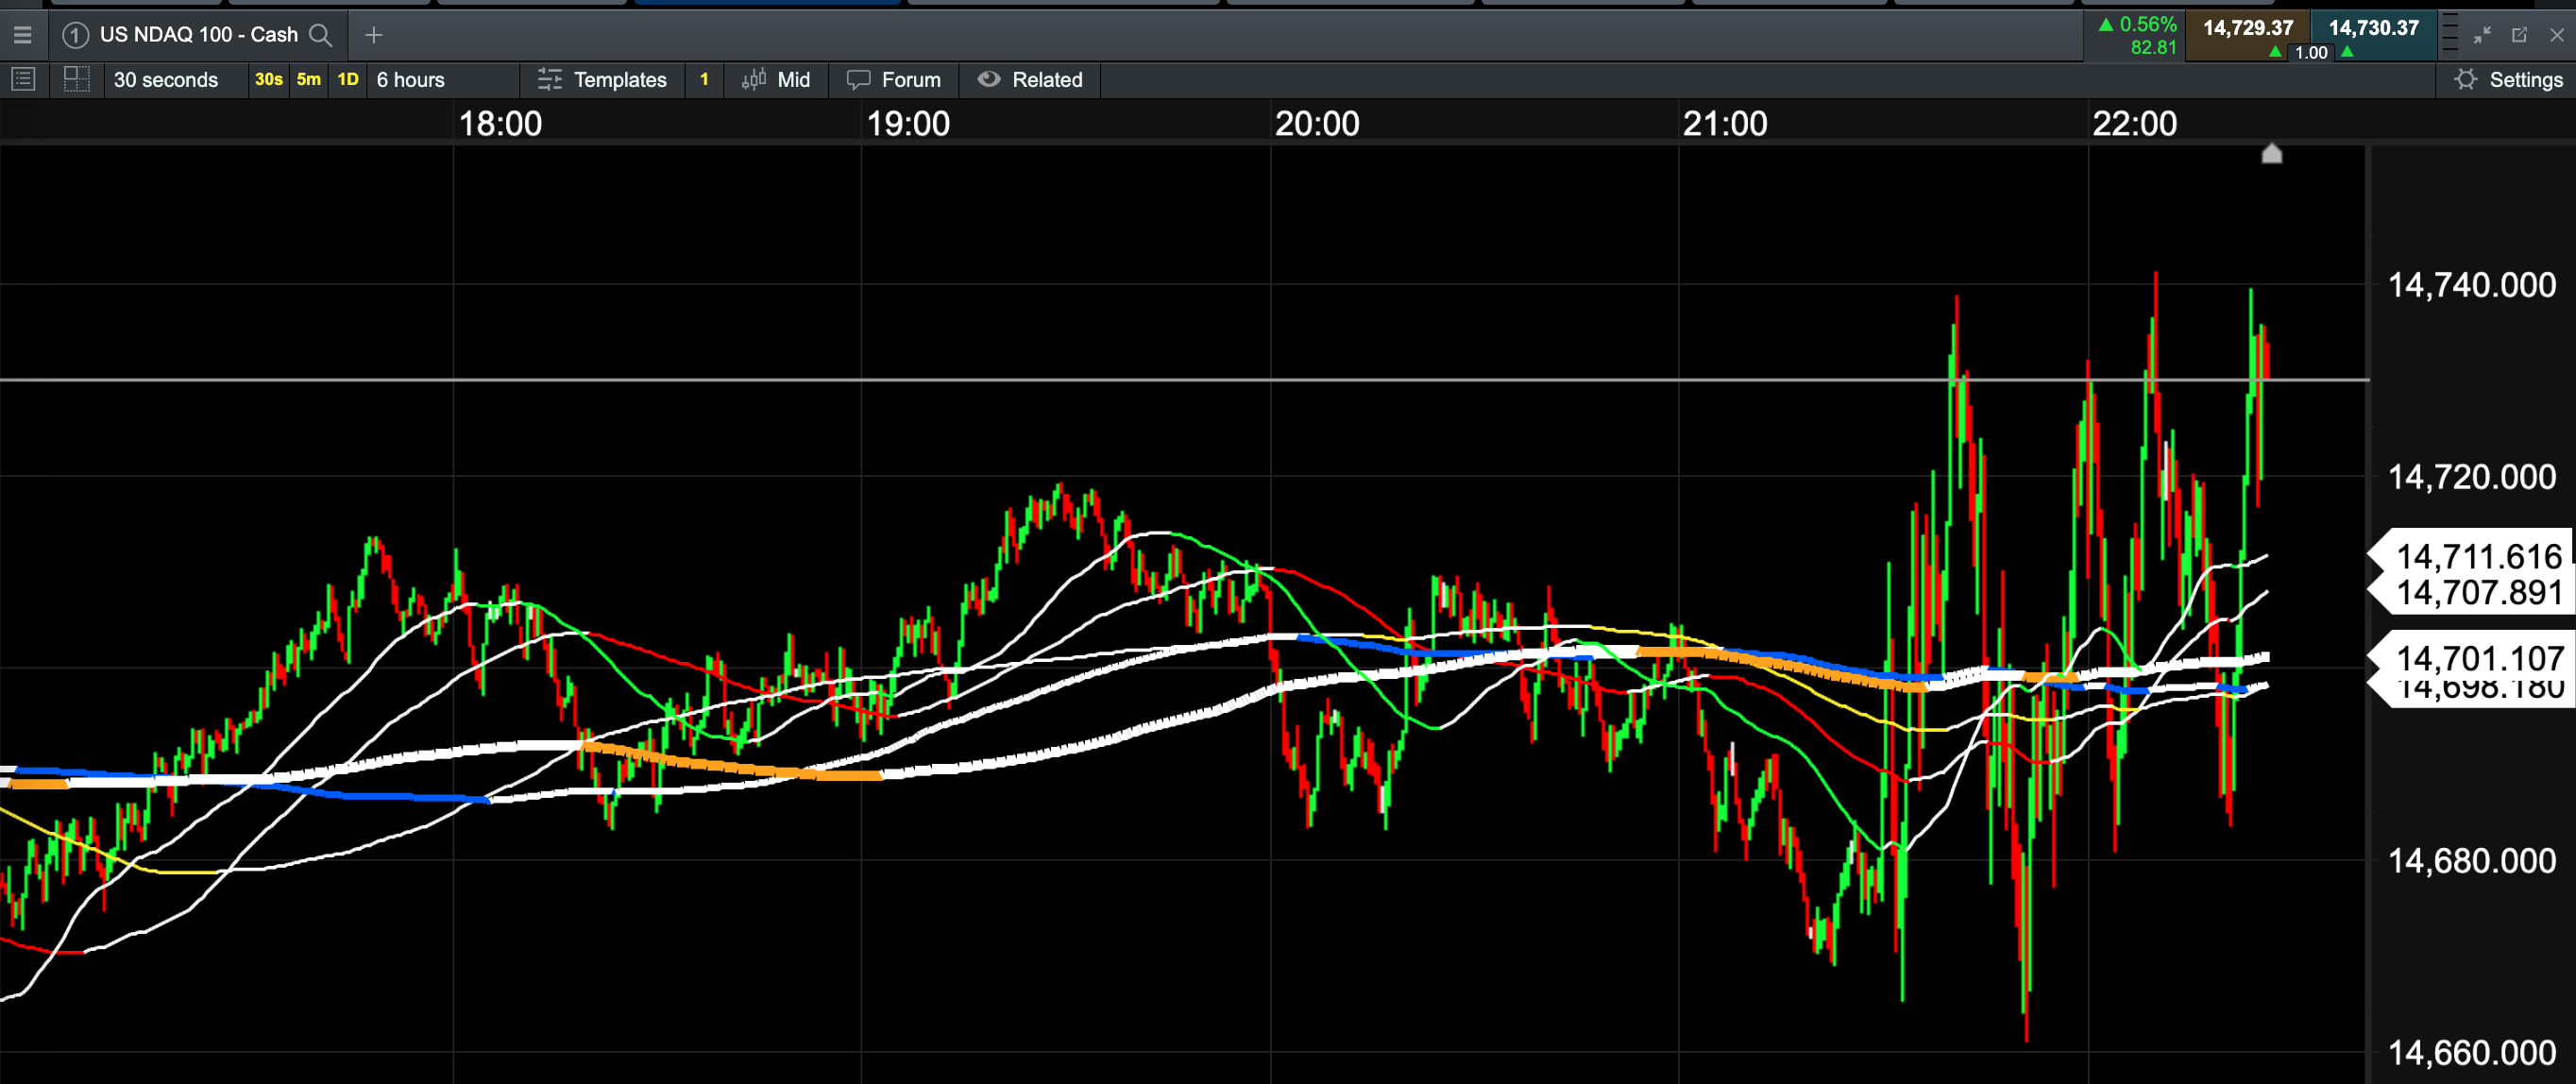
Now at 22:54 pm Hong Kong time on 2023.10.24, the market has been open for almost 90 minutes:
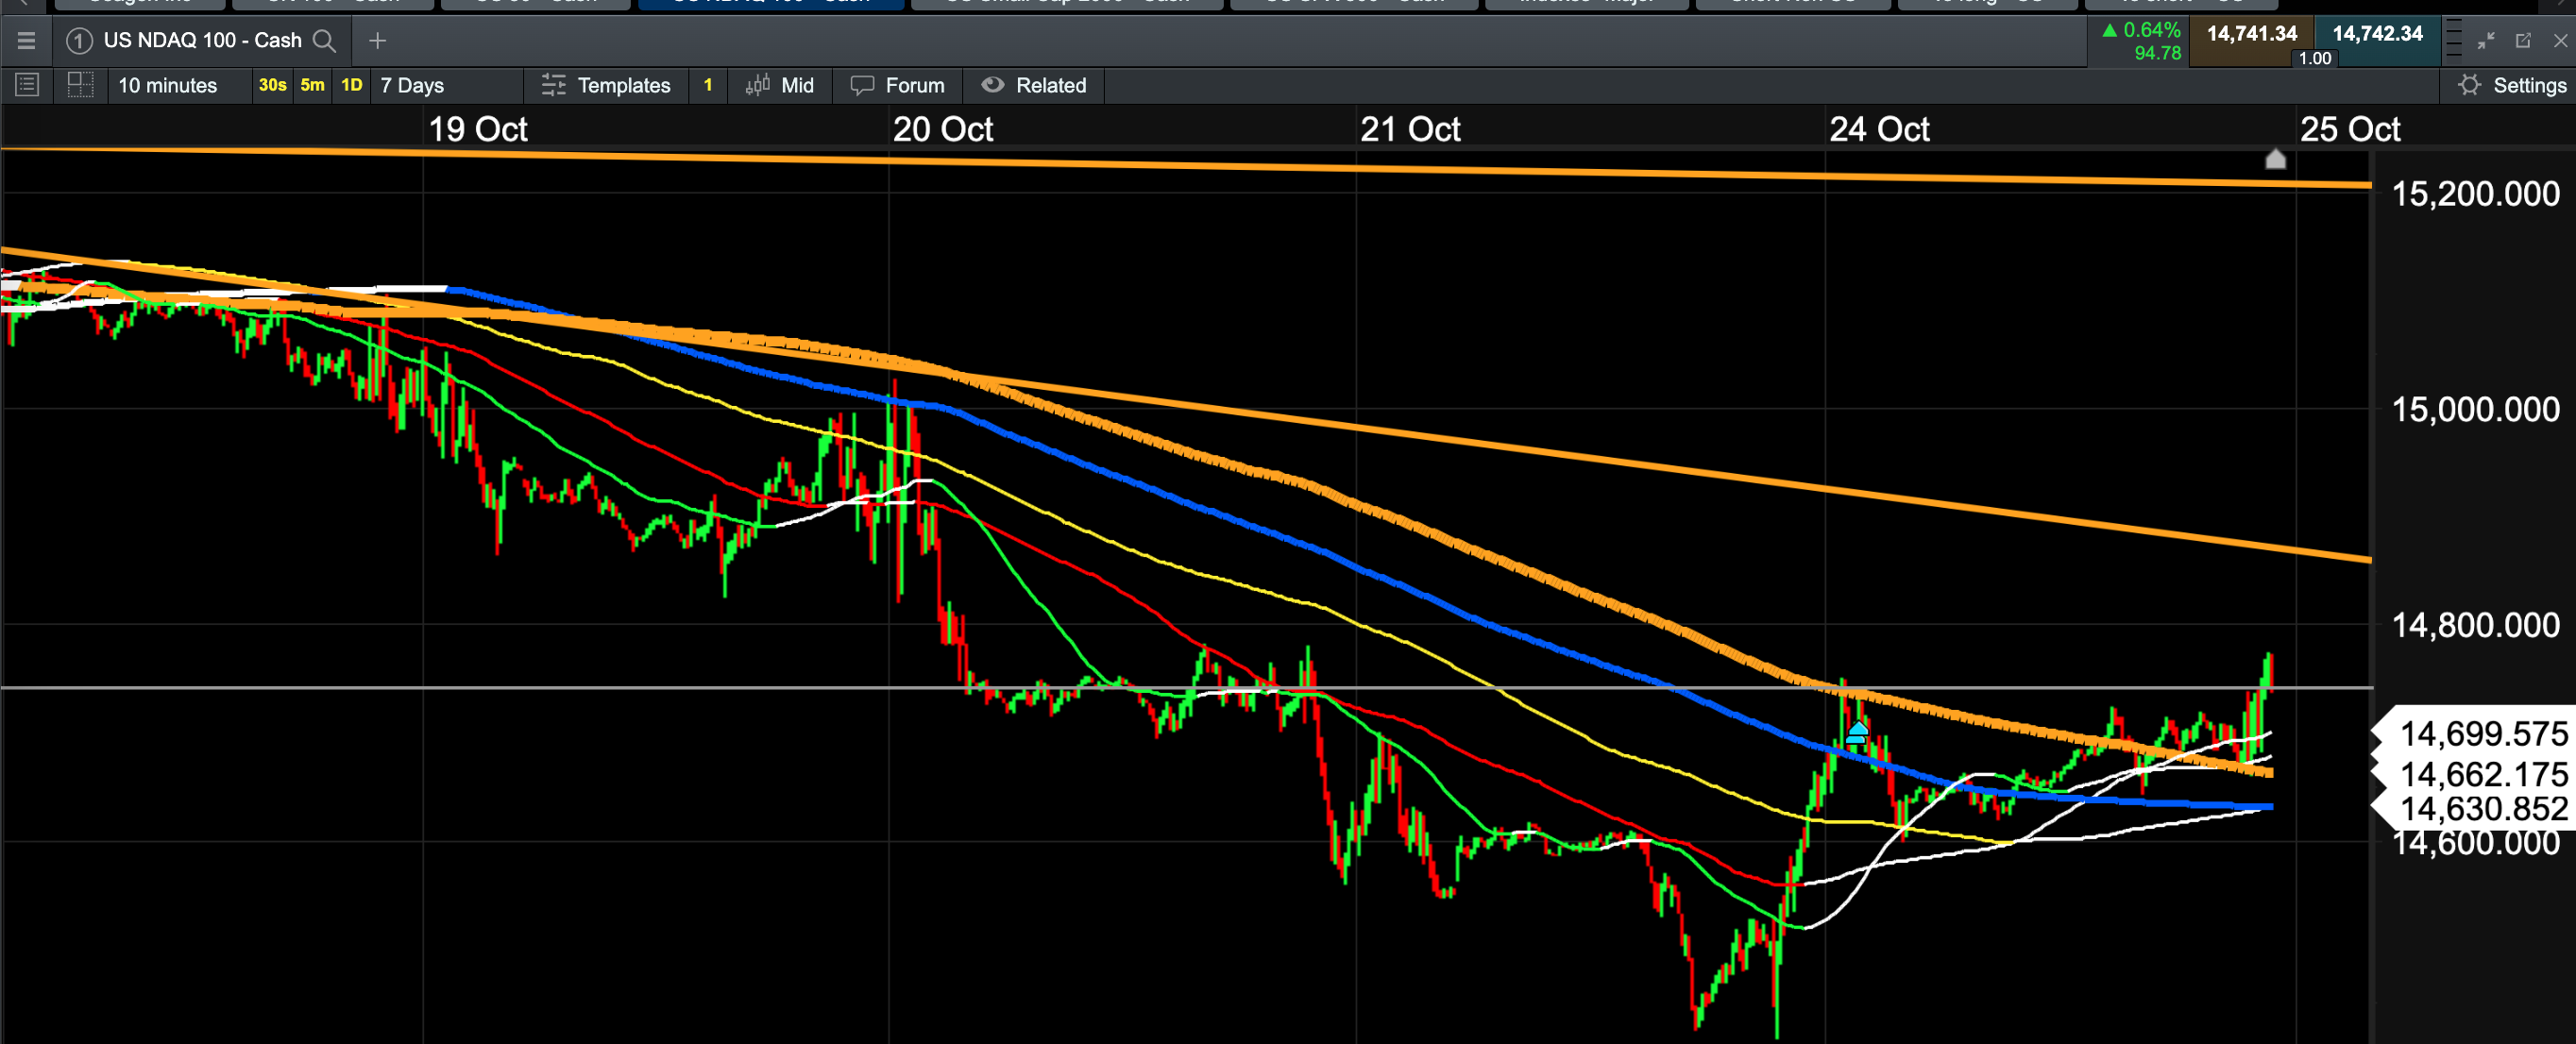
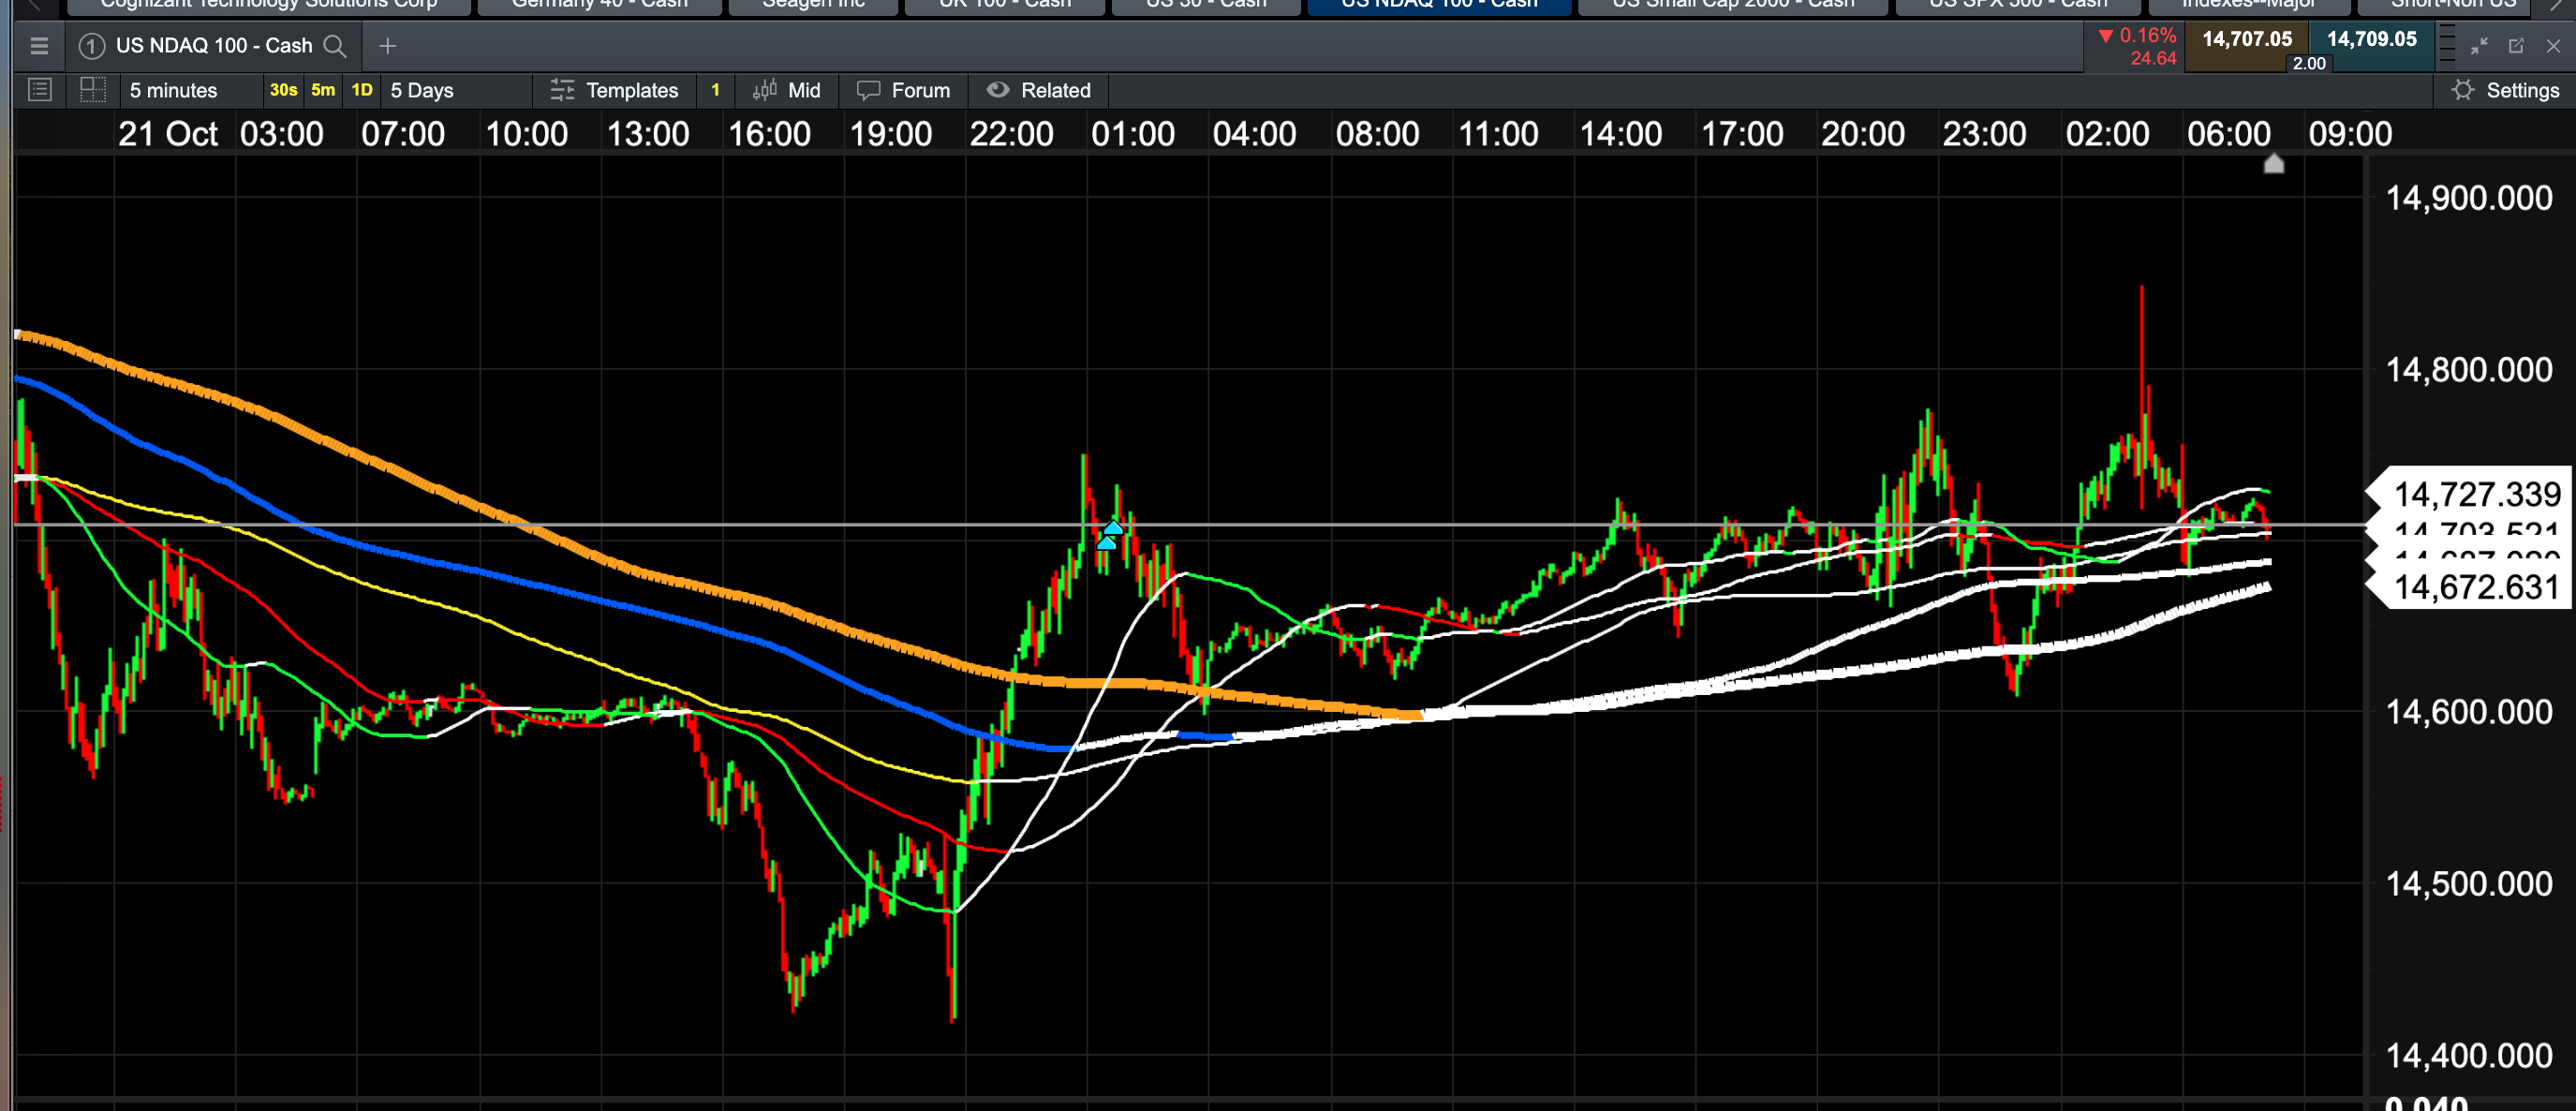
The market looks like the following in wider ranges:
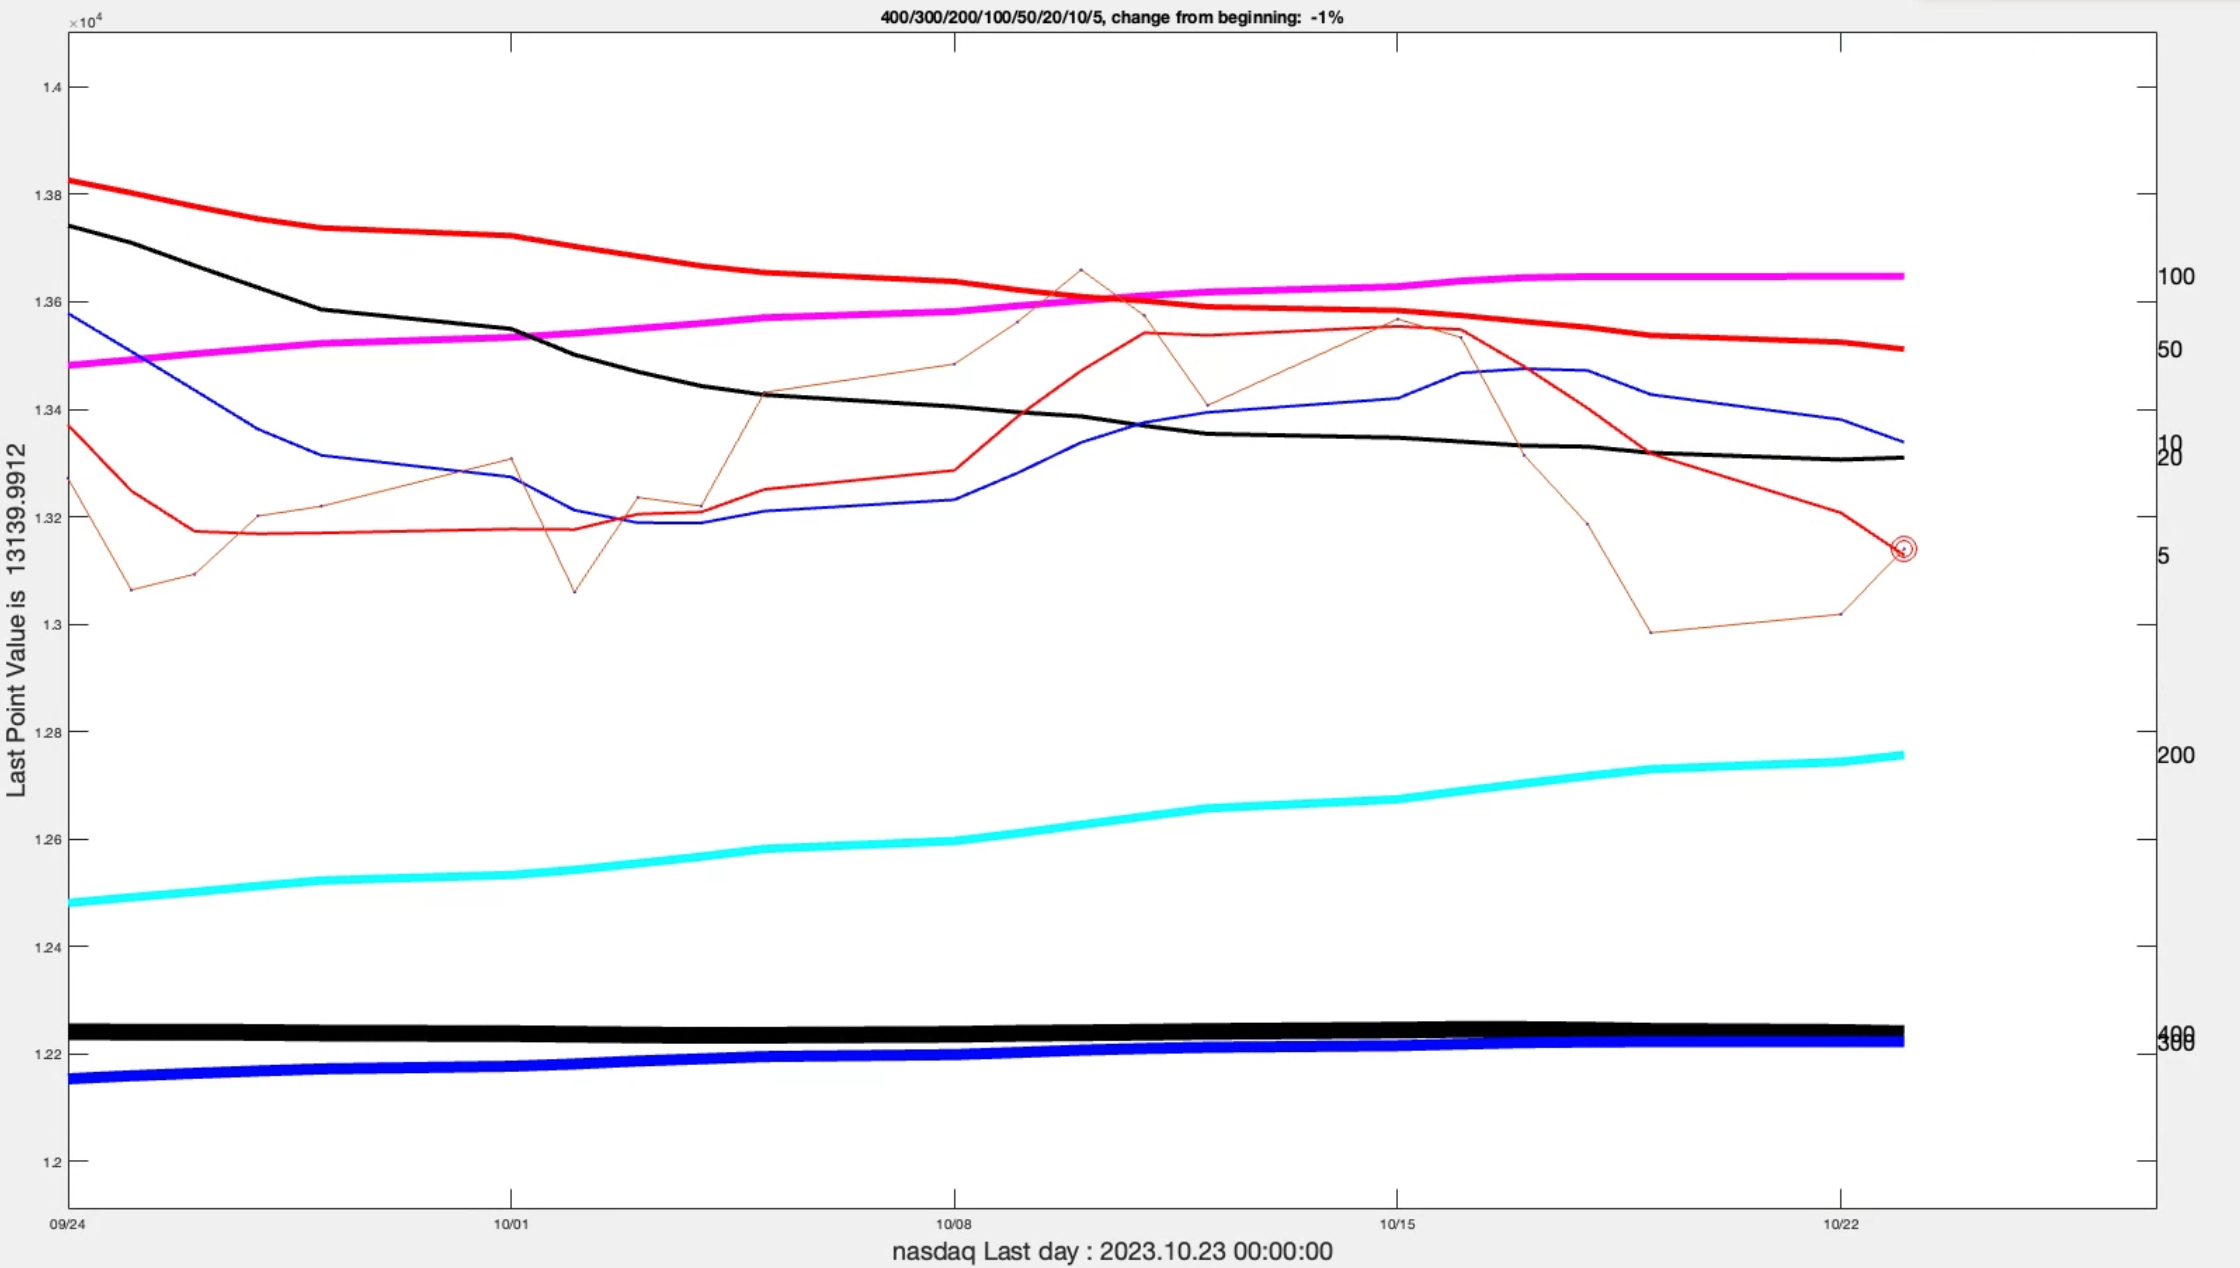

It is now the morning in Hong Kong: 8:12 am Oct. 25, 2023, the 5-day Nasdaq chart looks like this:
After the market opens today, the market dropped a lot due to Google quarterly report, as shown below:

It seems the pattern reversal is not confirmed so far.

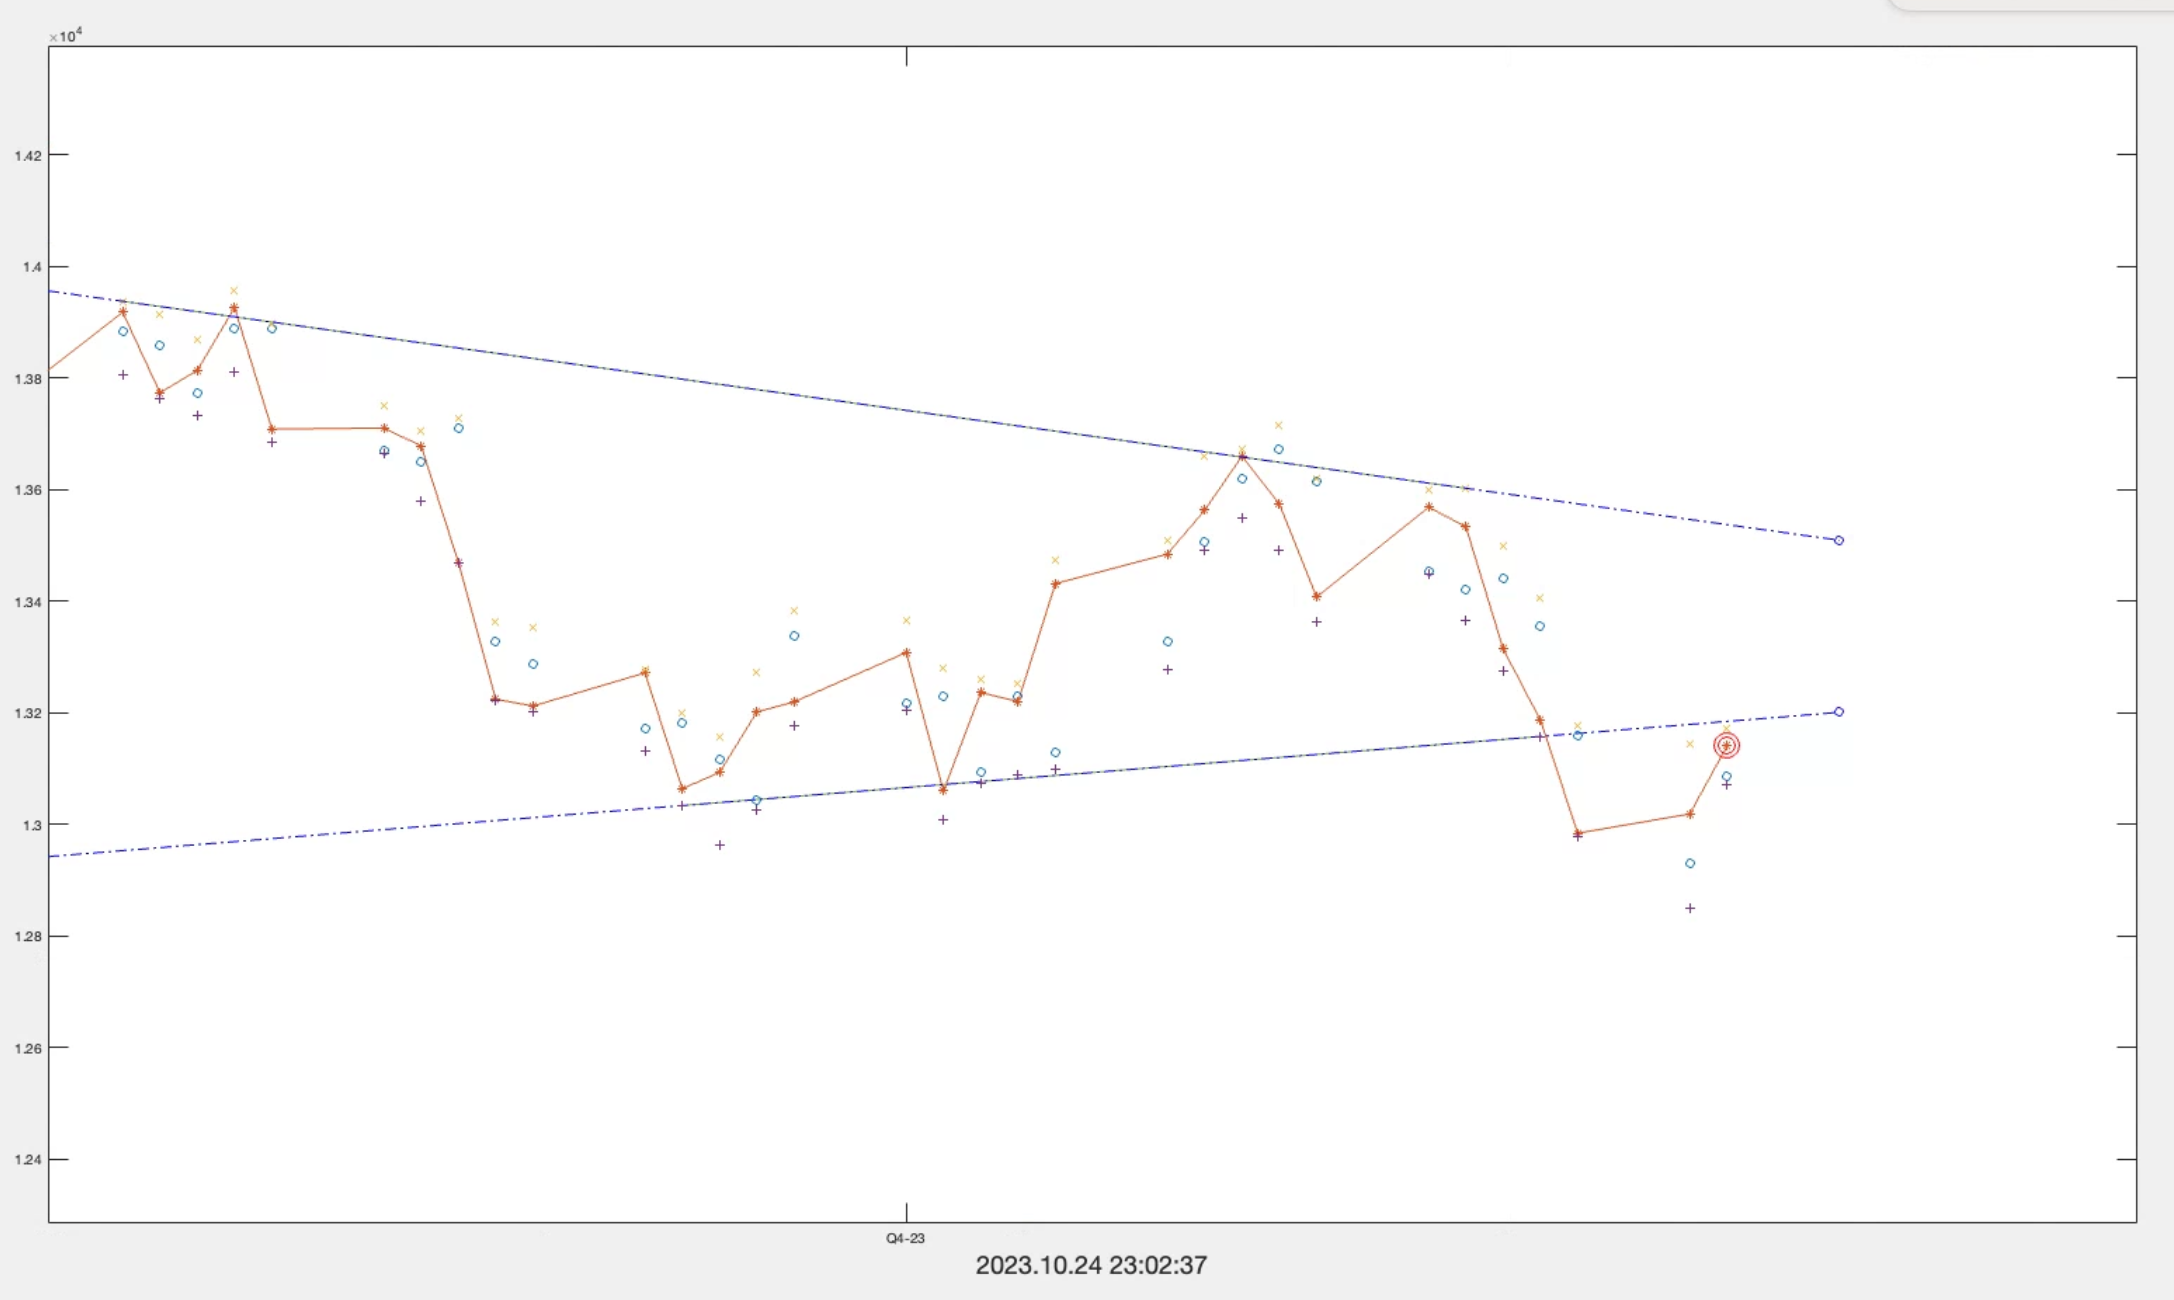
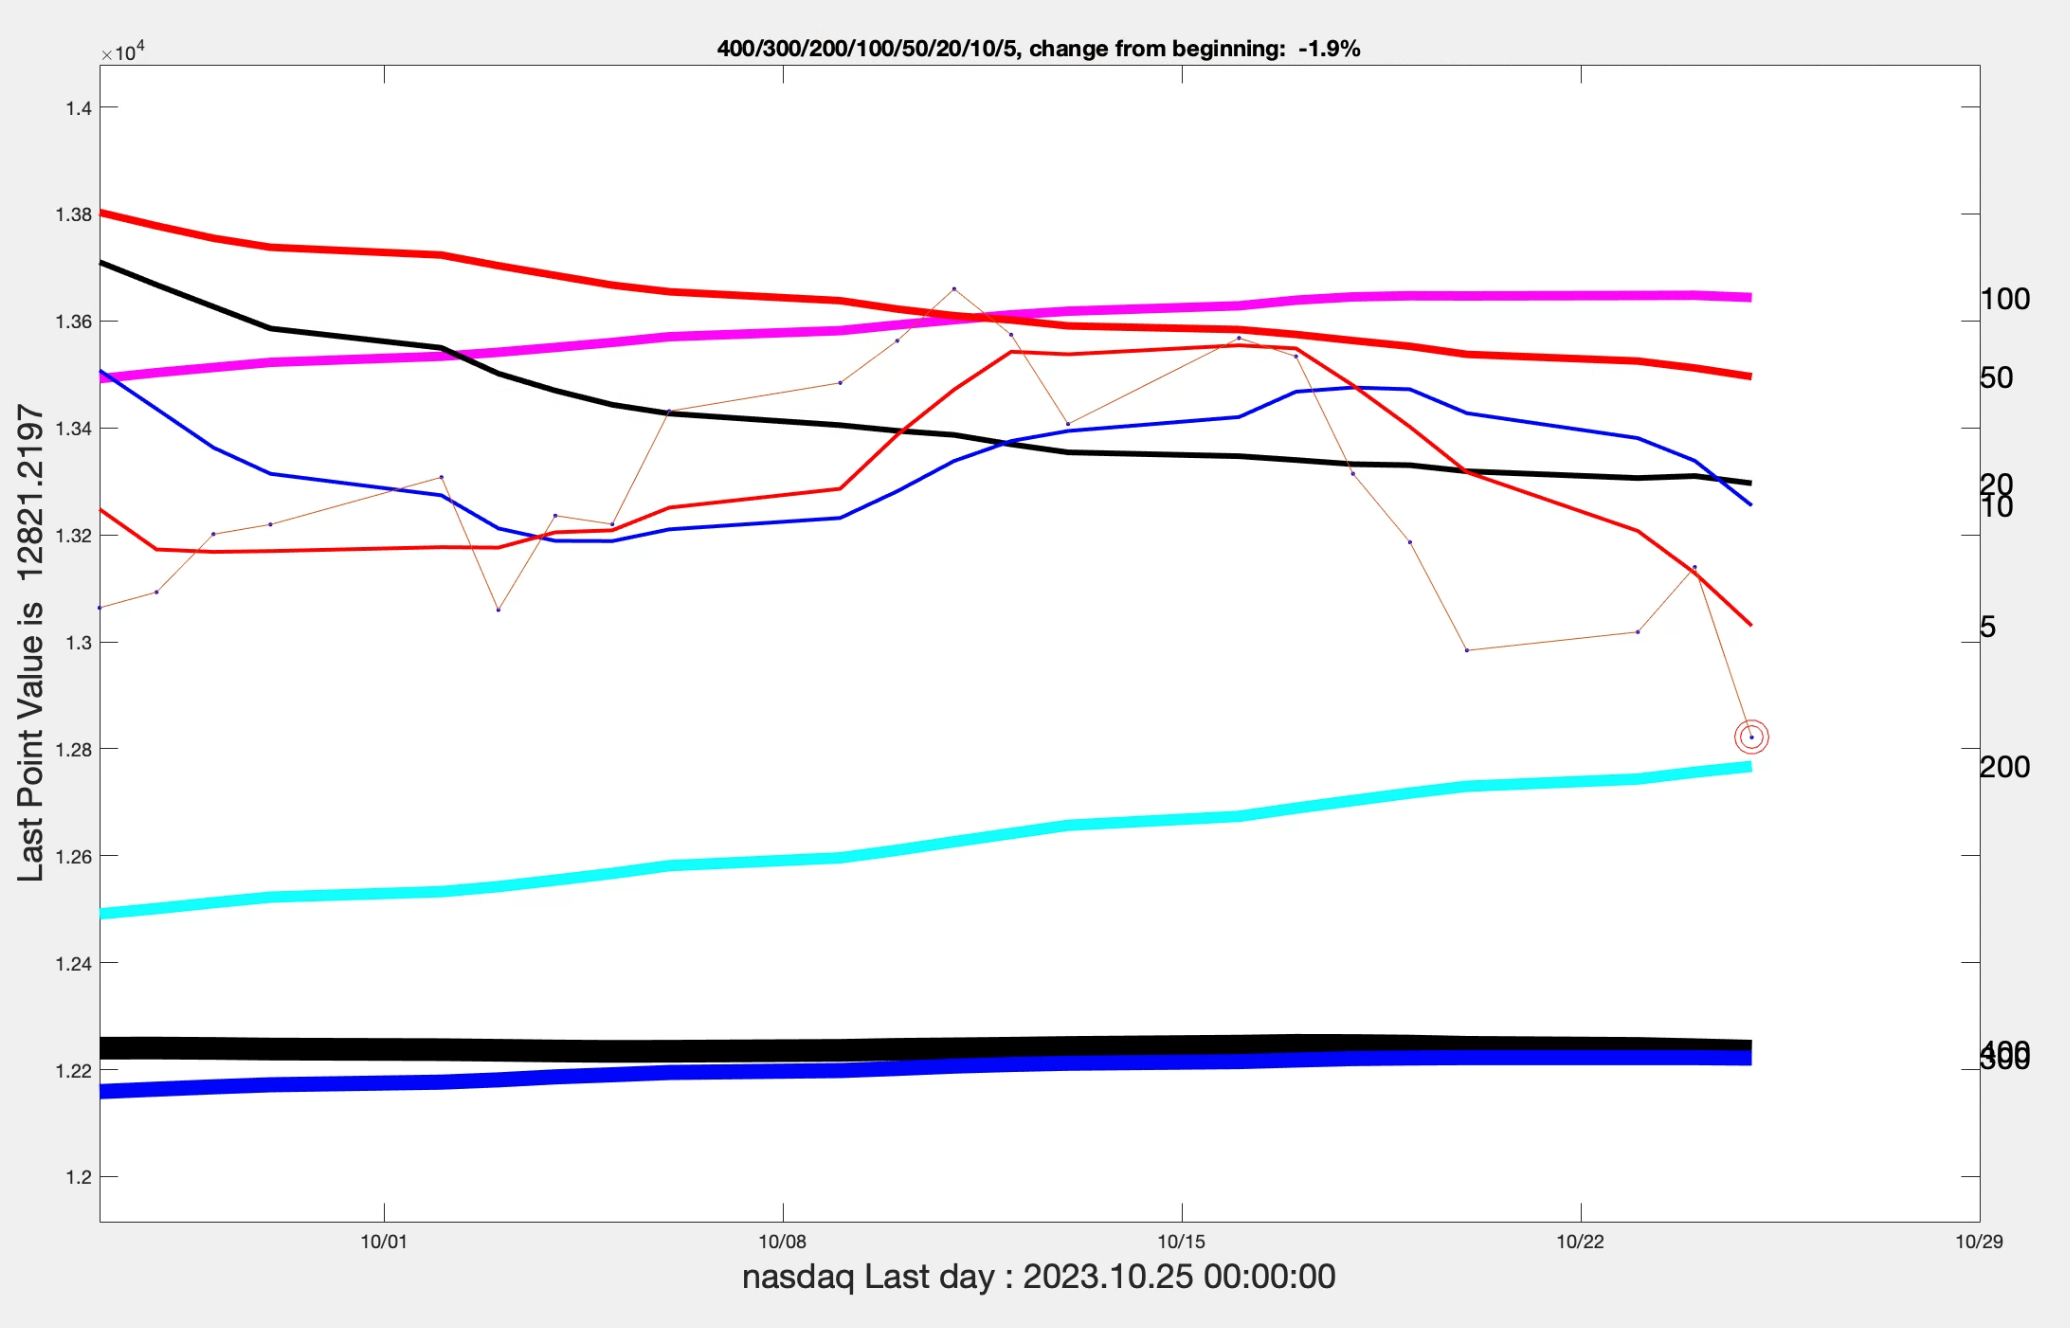
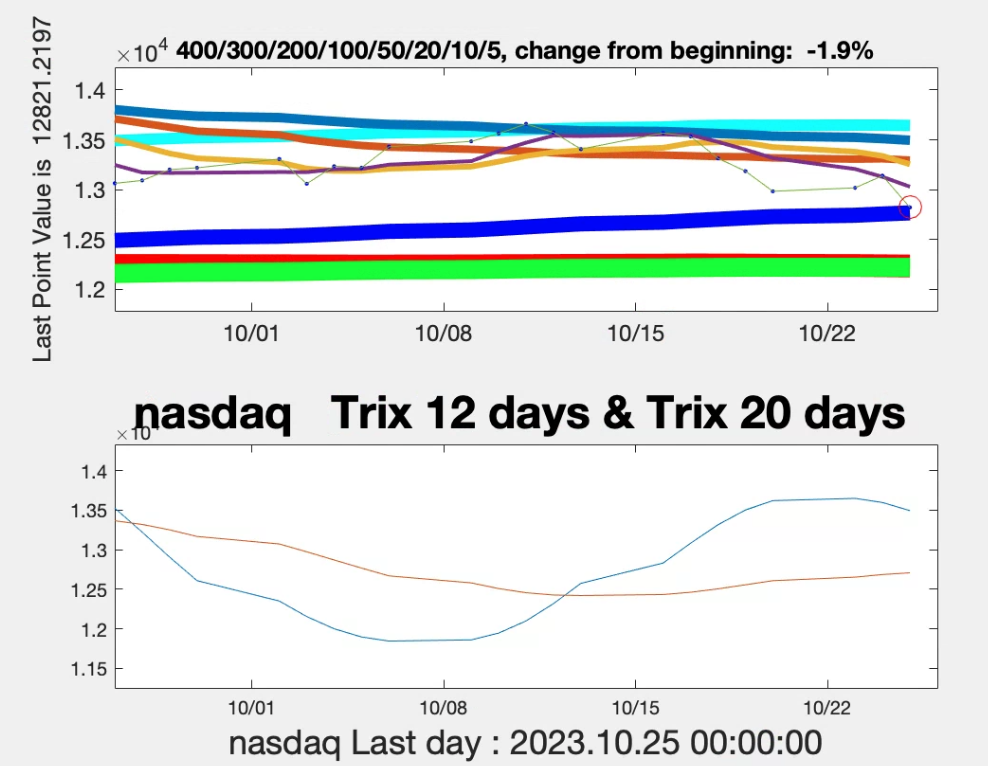
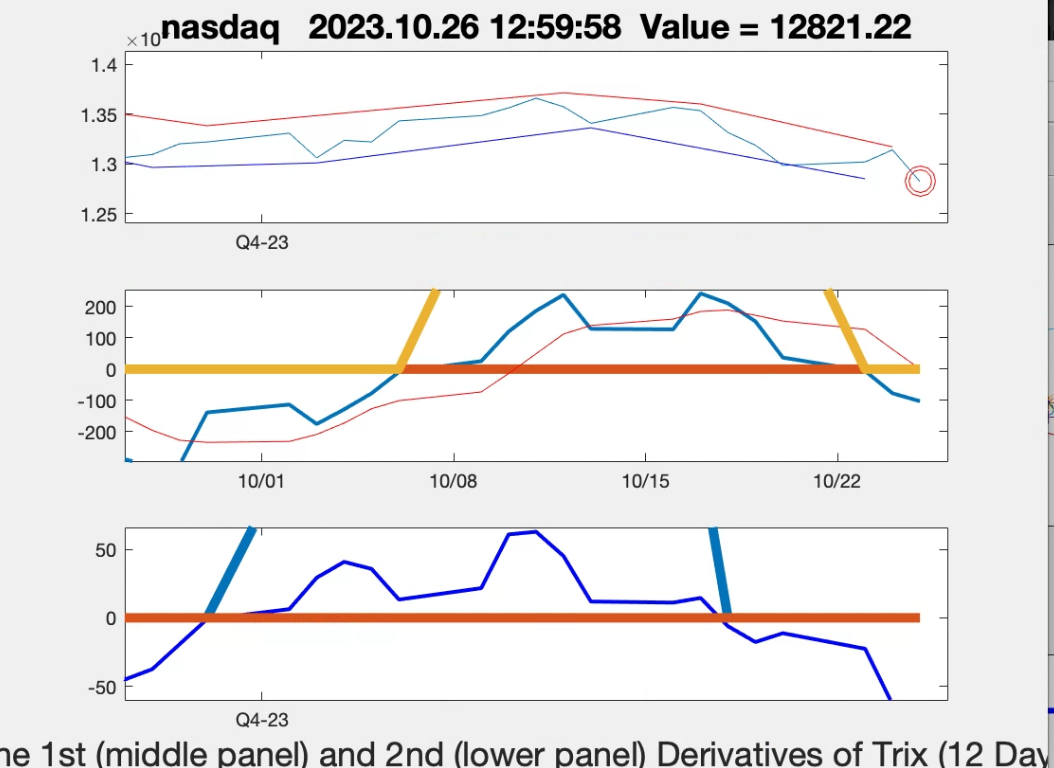
Now it is Oct. 26, 2023 noon in Hong Kong, the nasdaq chart looks like below. A reversal must wait for the prices to continue rising to confirm.


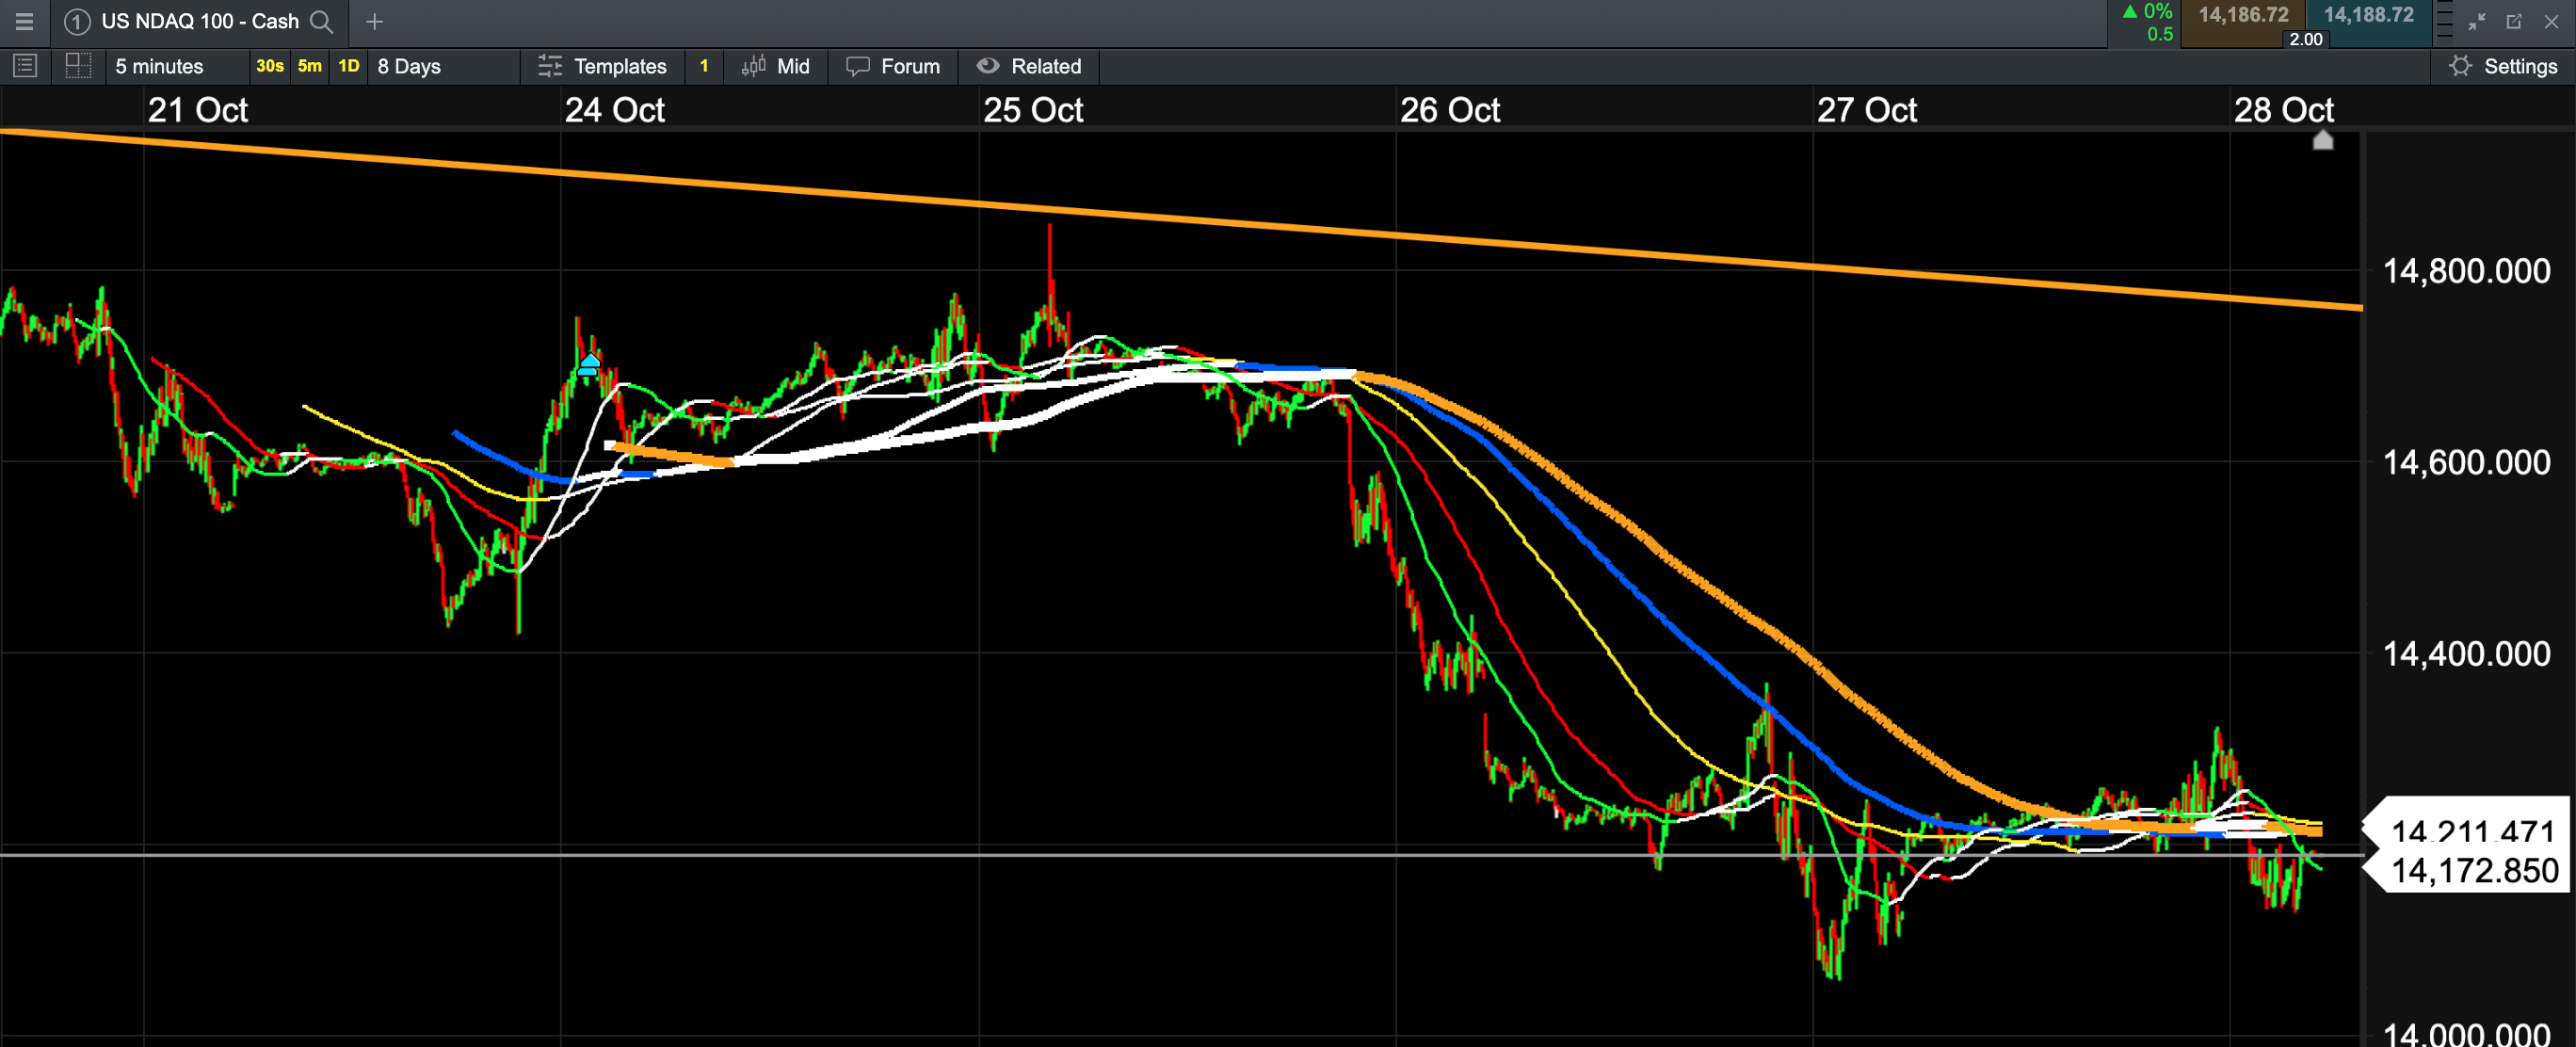
Today is 2023.10.28 Morning in Hong Kong, Nasdaq closed a bit up overnight, ending the week as below:

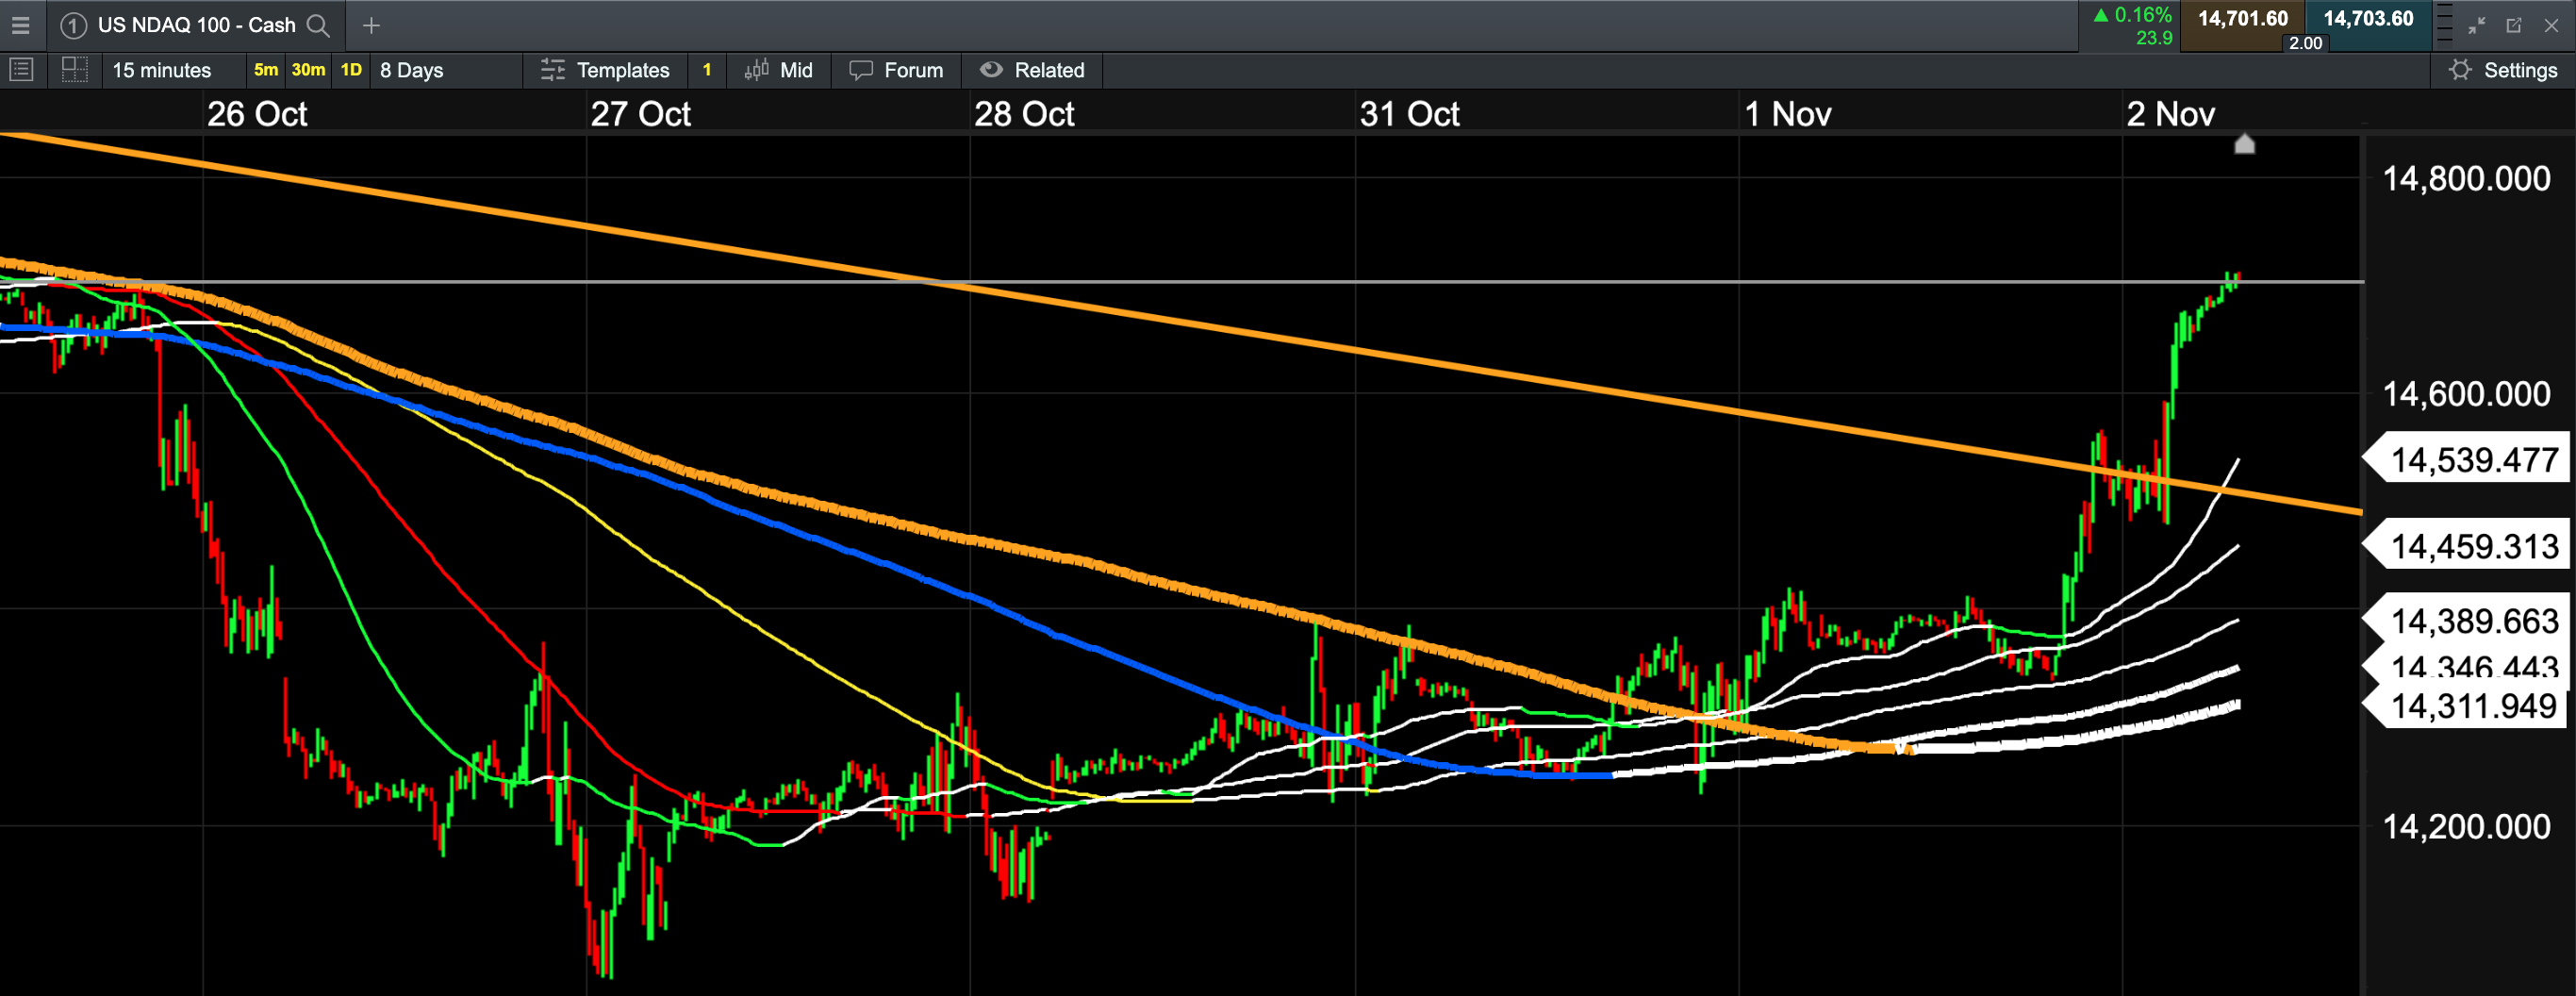
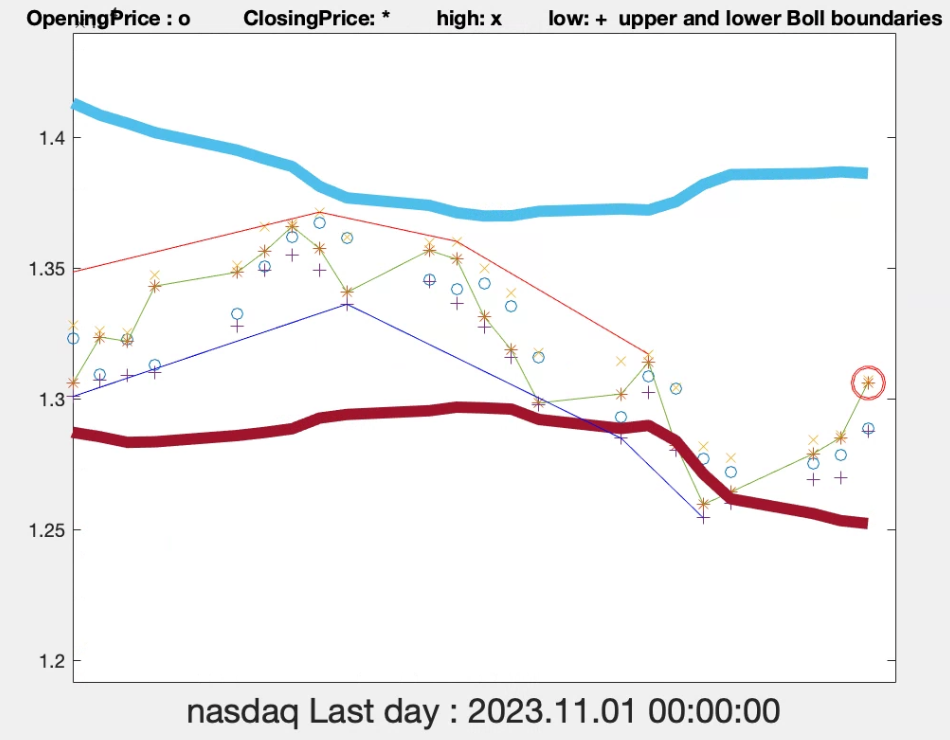
Today is 2023.11.02 , Hong Kong time, 2023.11.01 in the US, 8:12 am. The markets have been rising and rose strongly last night after FED meeting, as shown below in the 8-day chart, it recovers almost all the loses in the past 8 days:
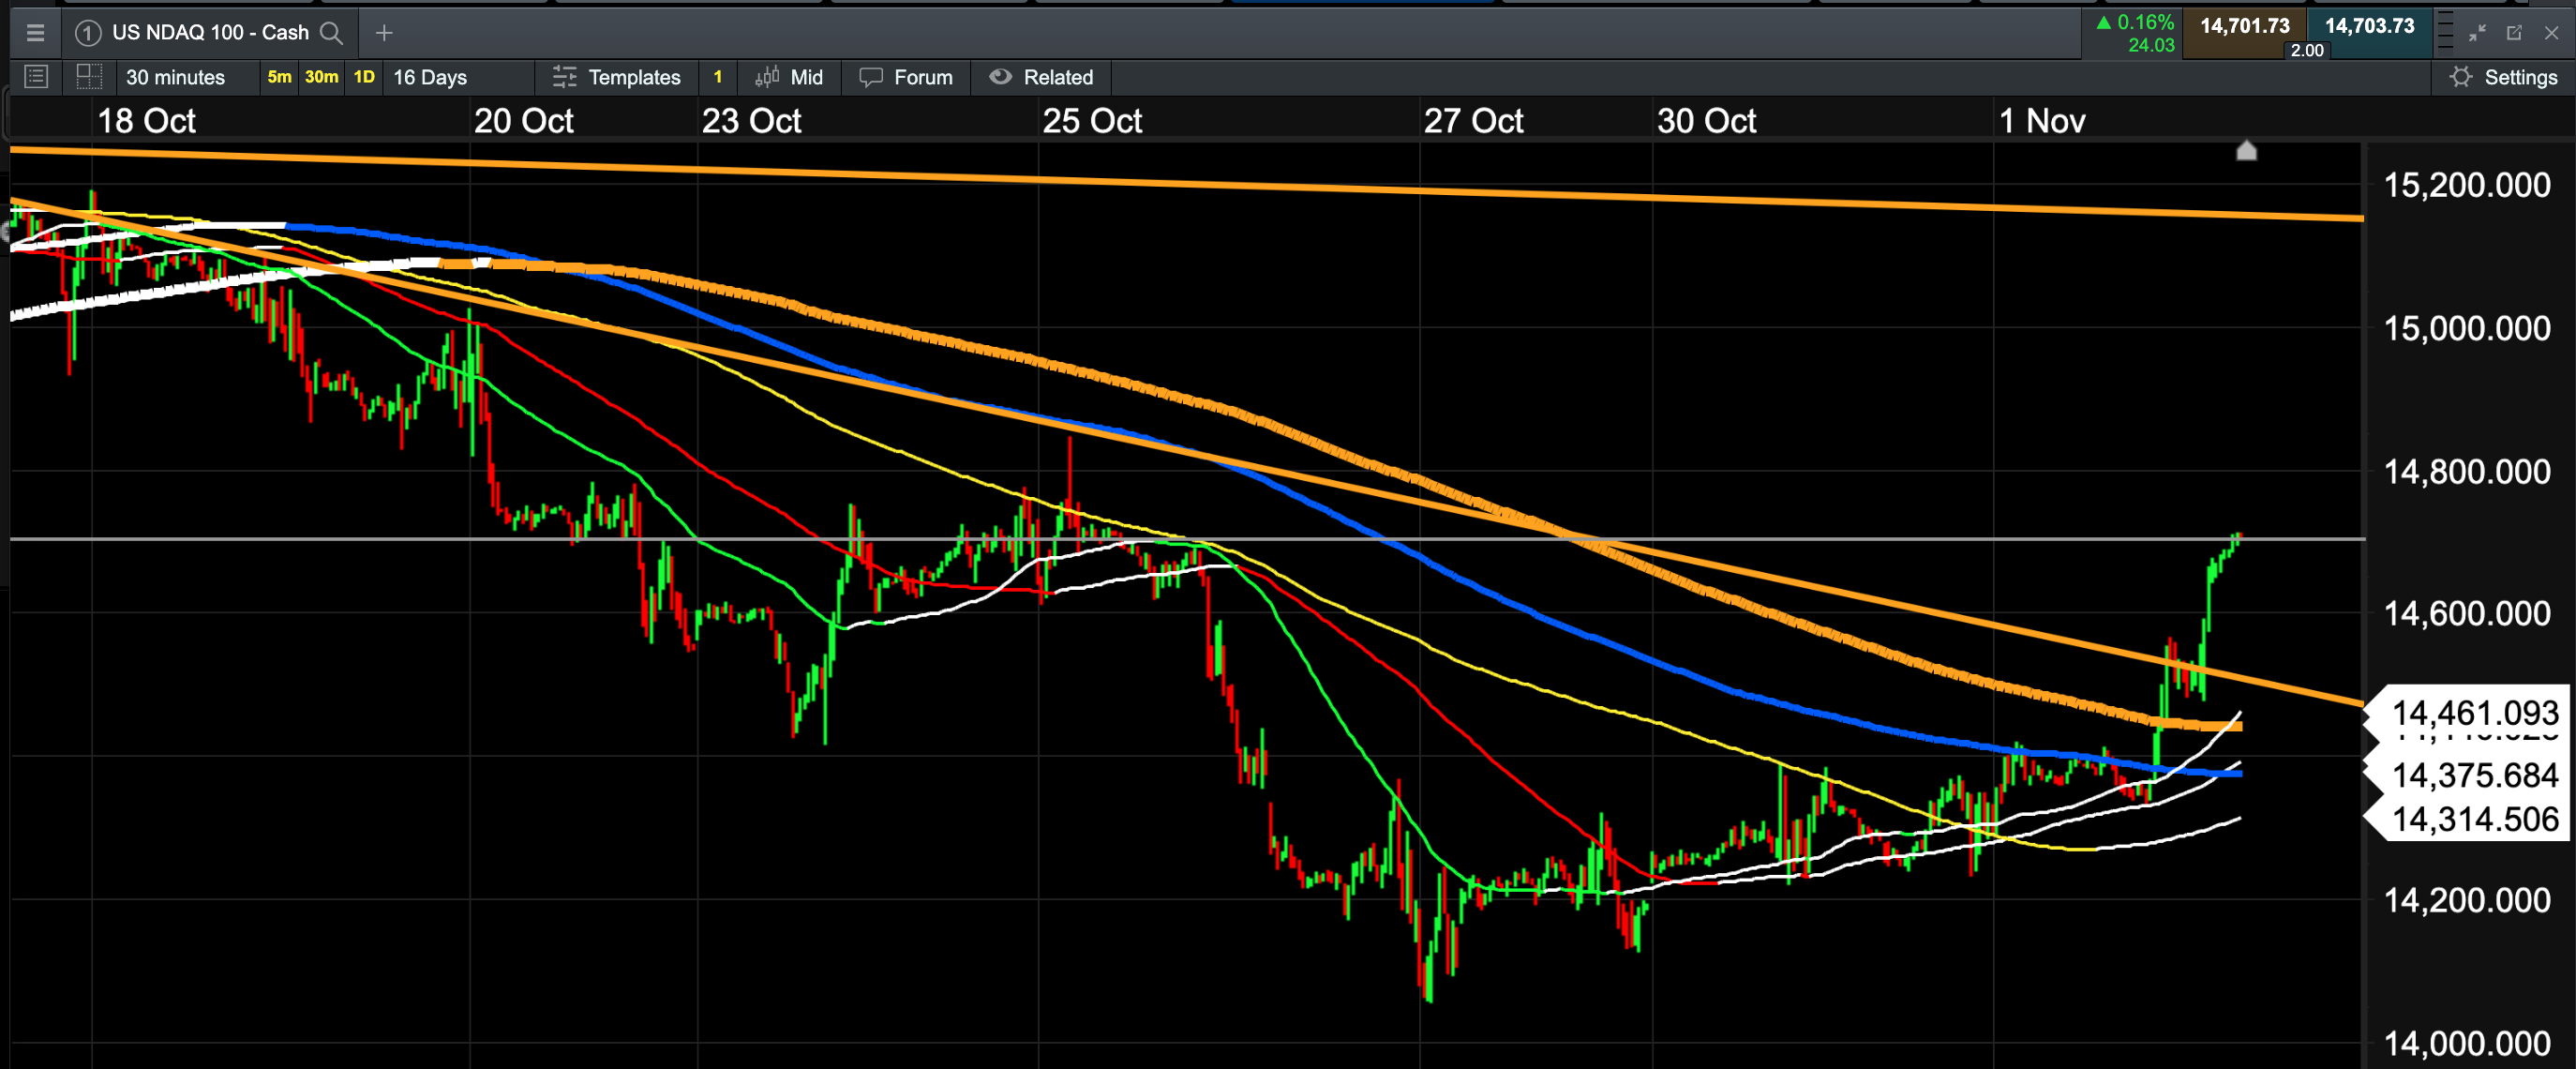
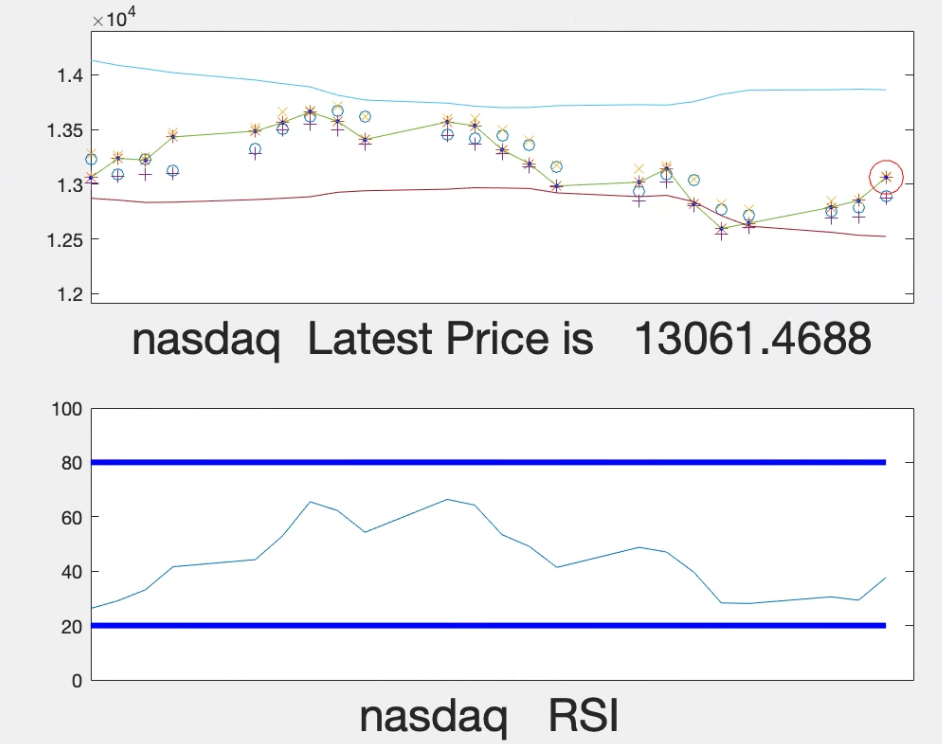
Its 16-day chart looks like this, is it confirmed of pattern reversal ?
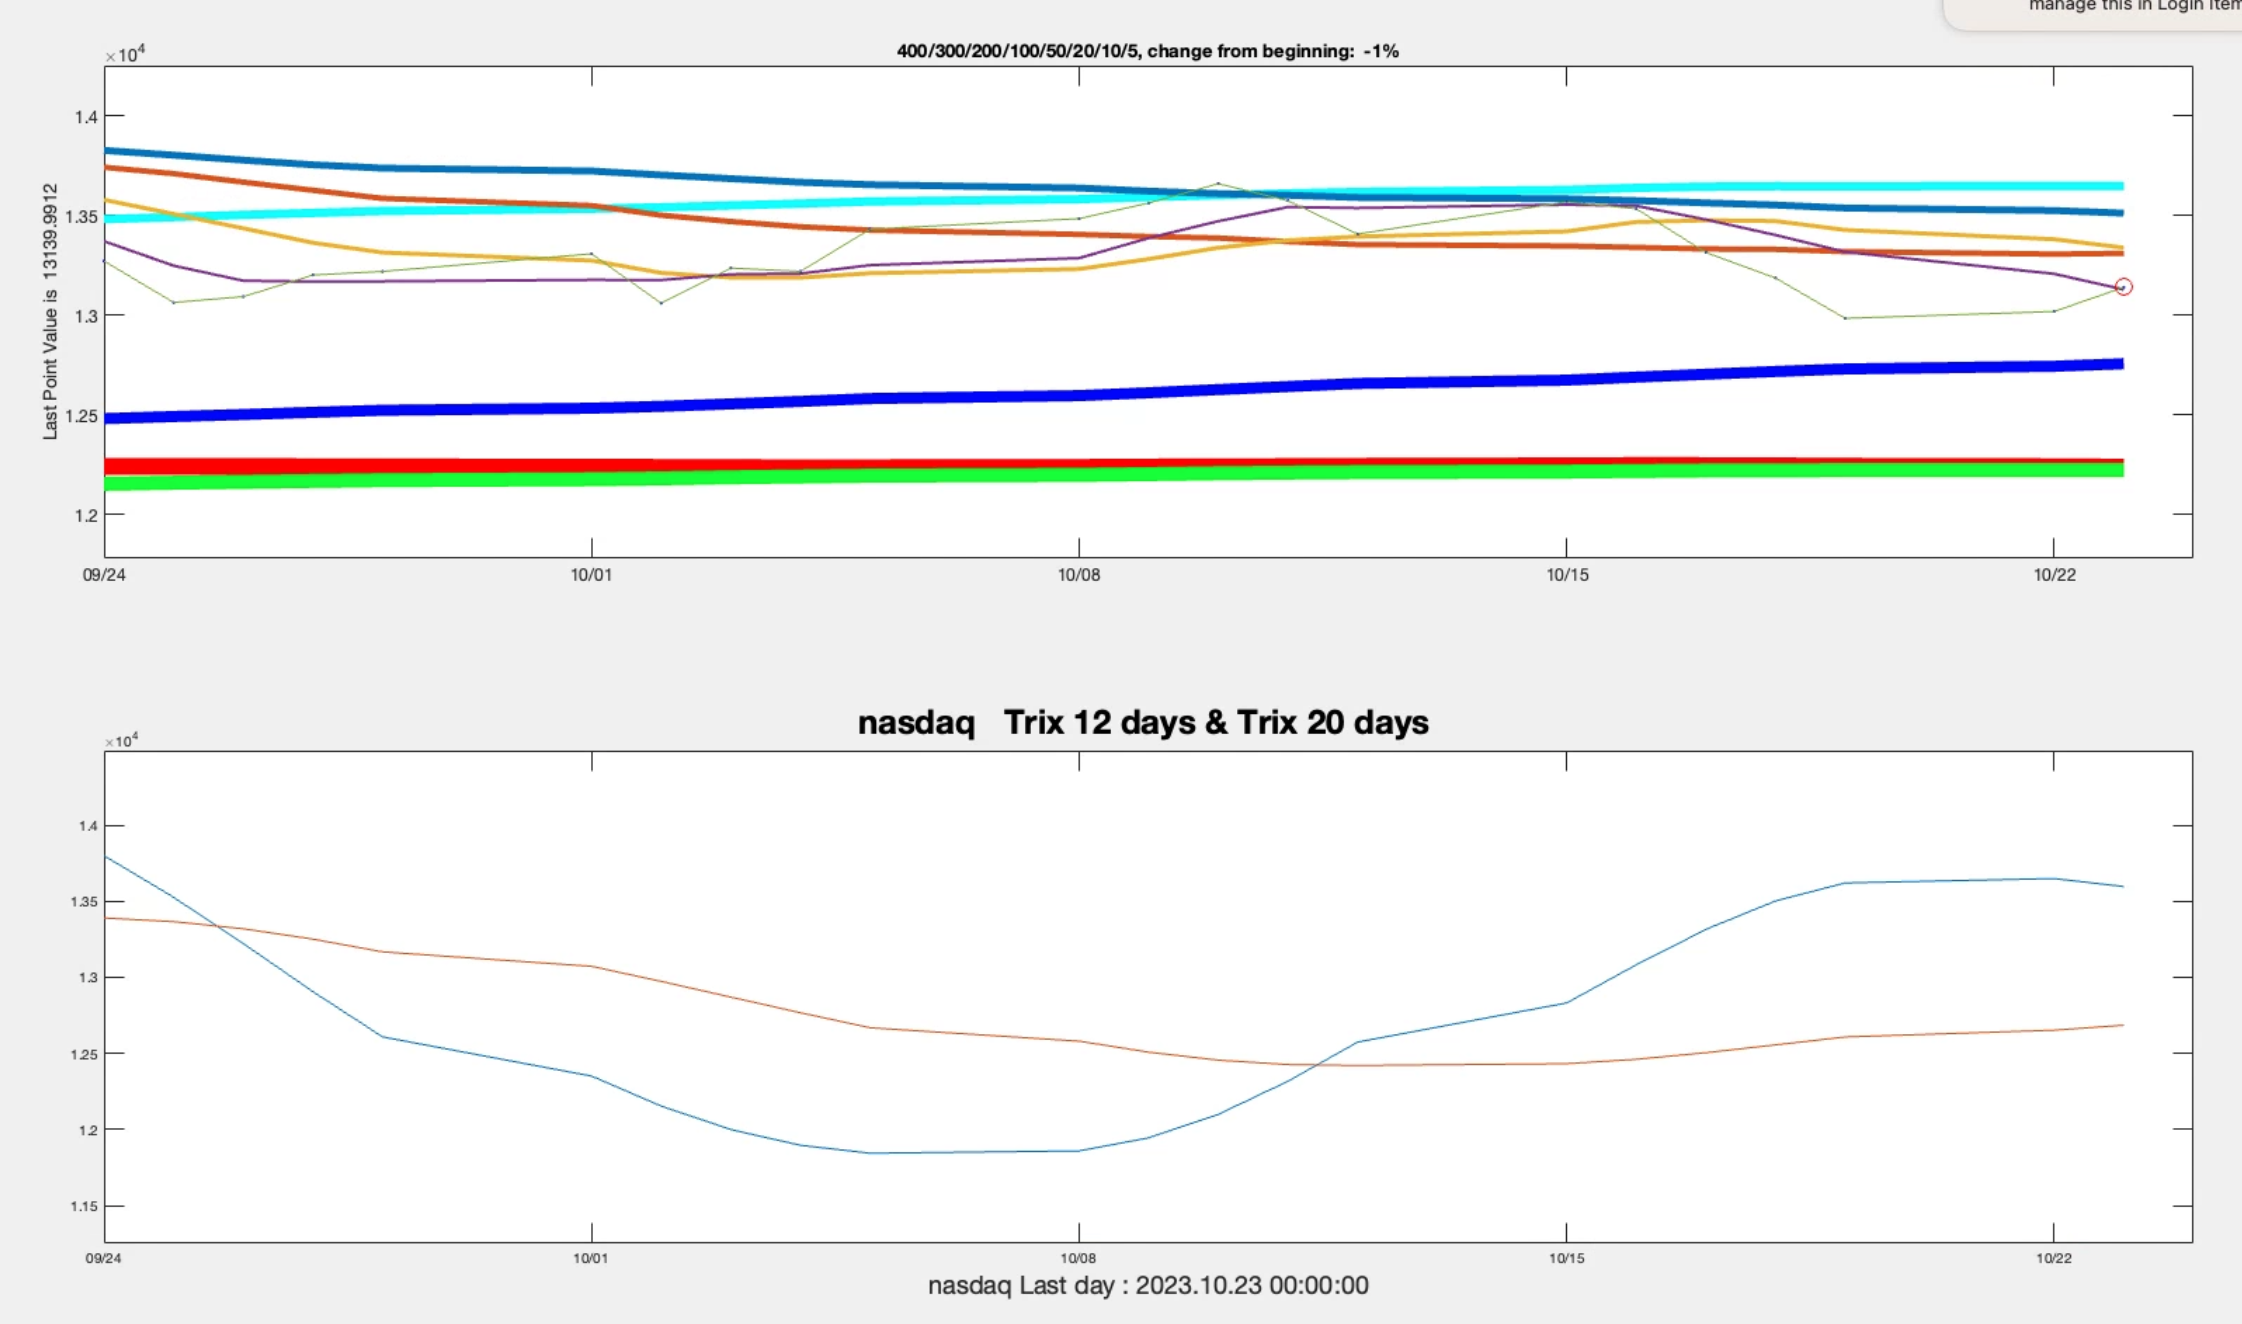
 30-day chart looks like:
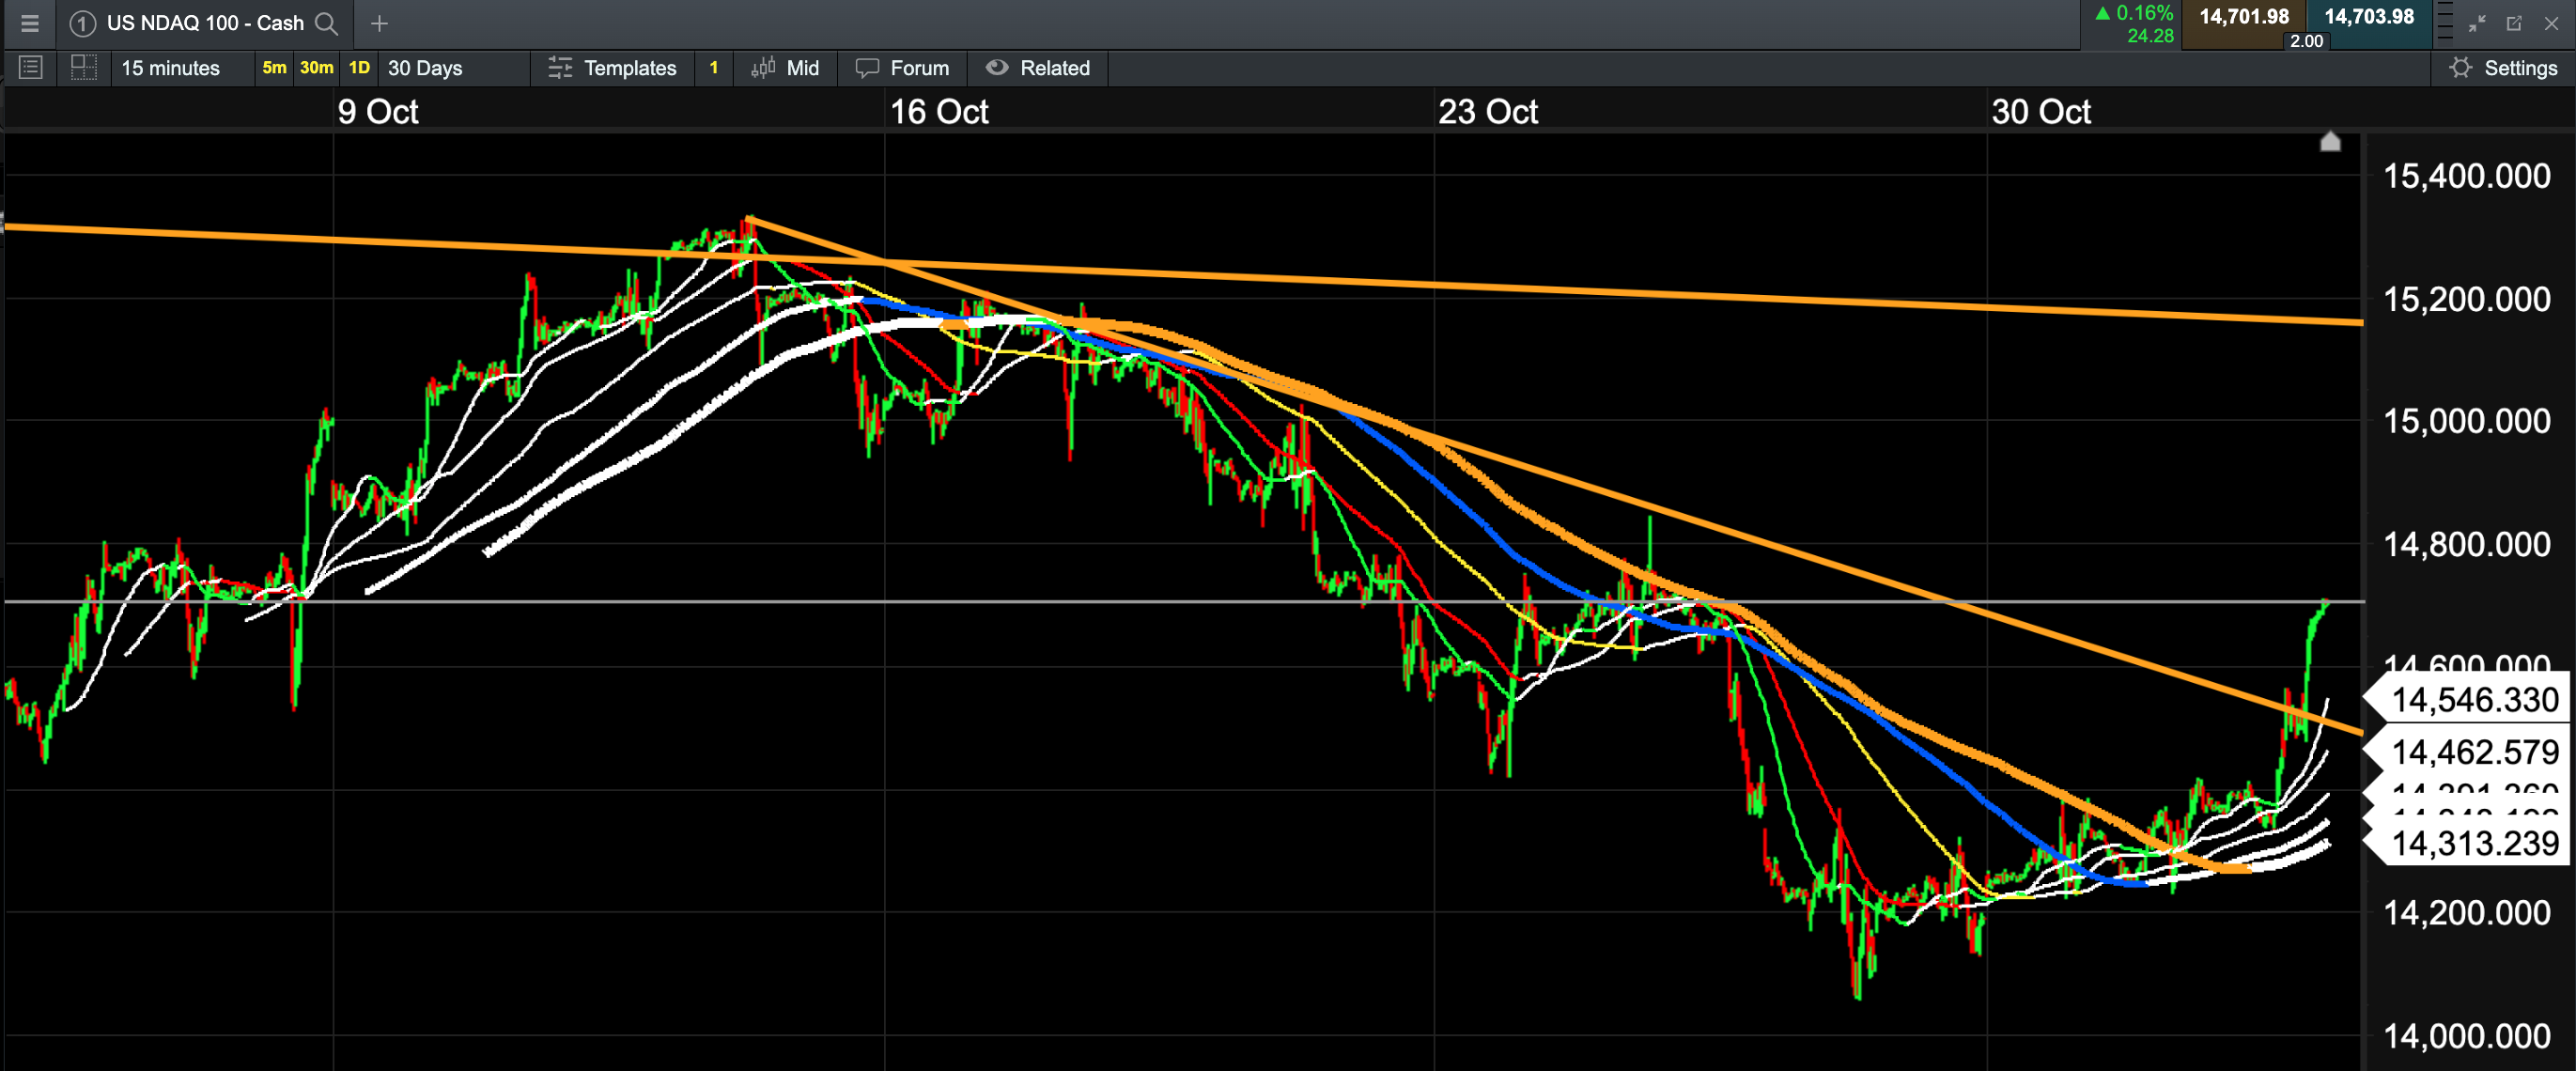
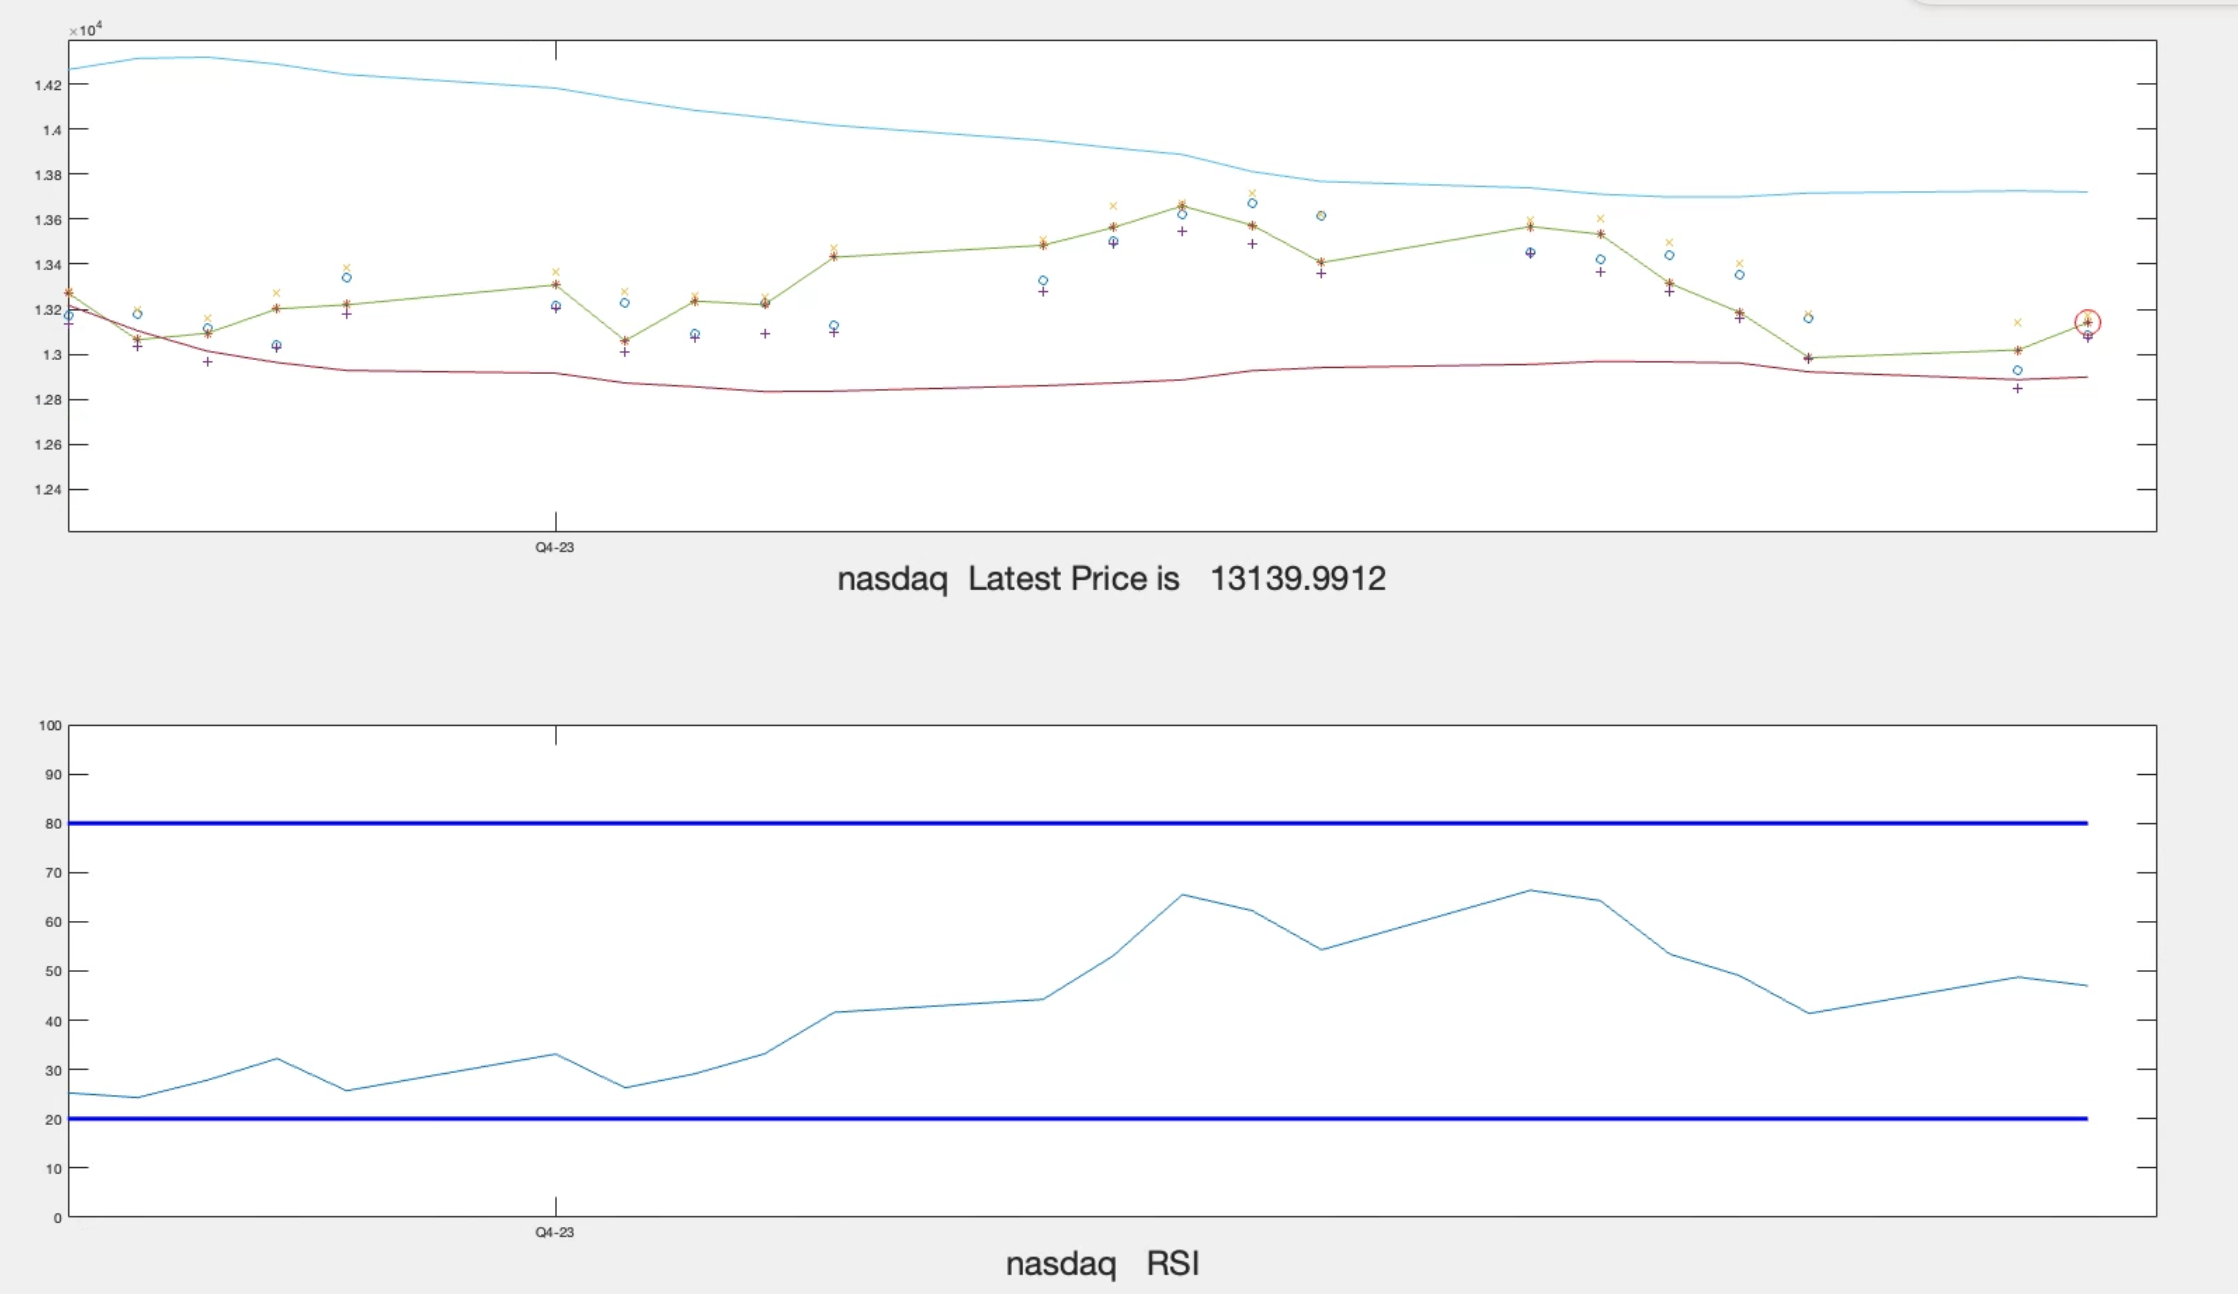
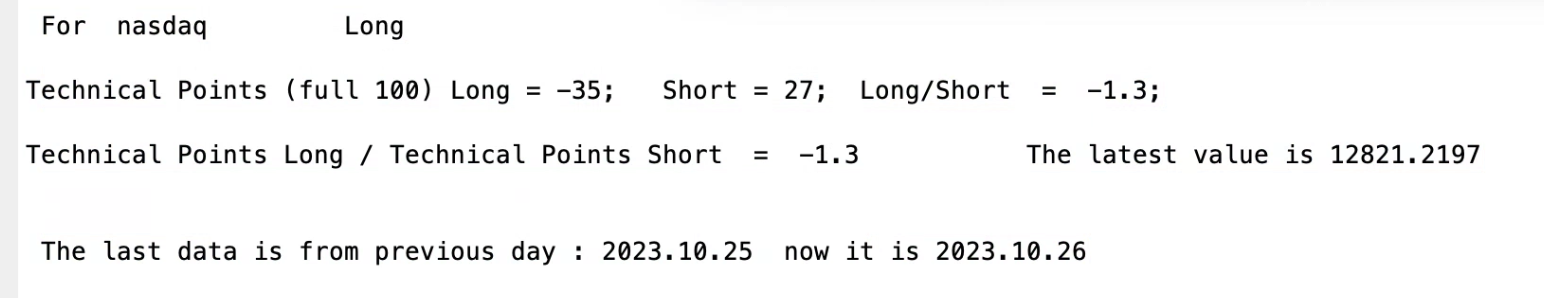
Technical charts are shown below:

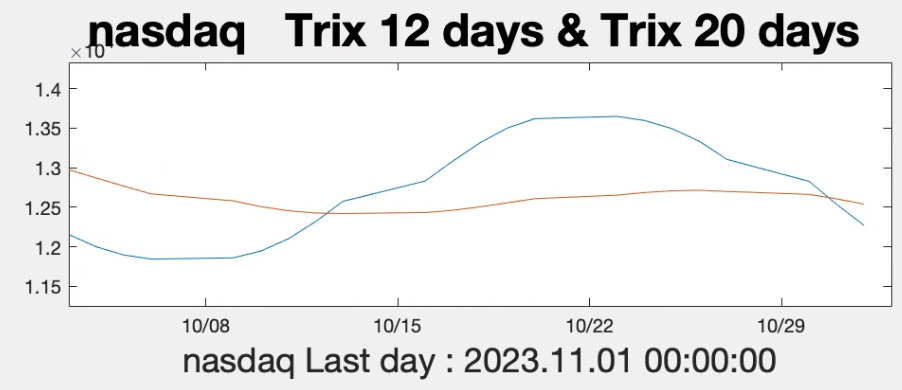
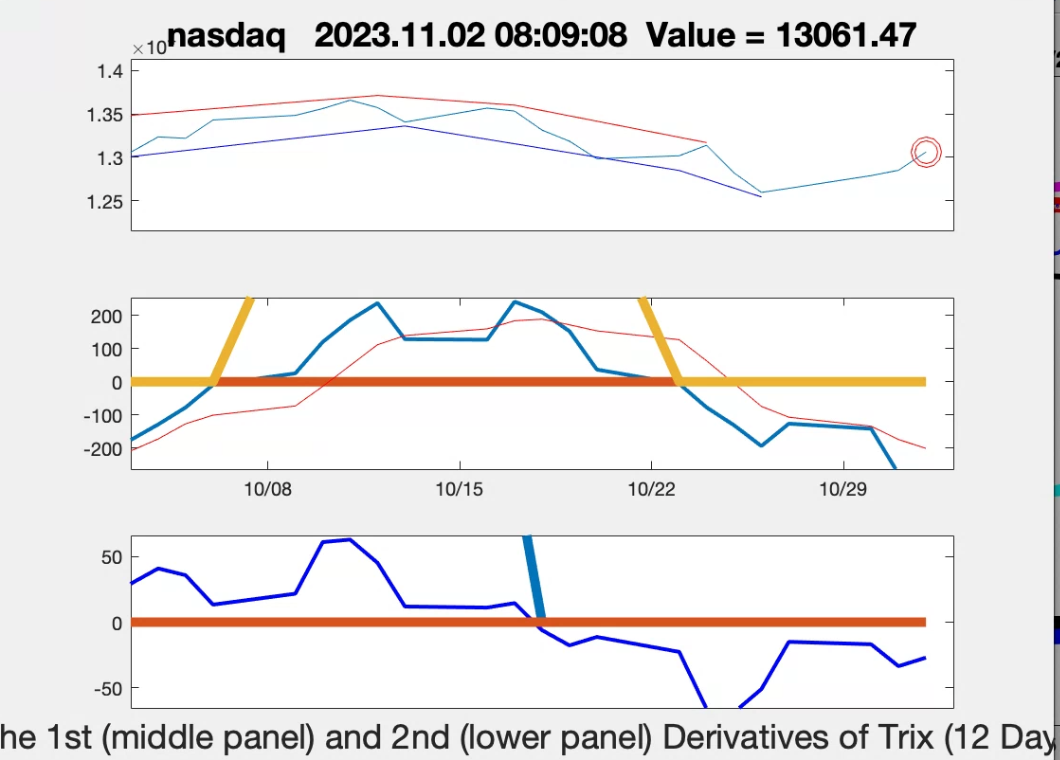
Technical Points (full 100) Long = -7; Short = 1; Long/Short = -7.3;
Leave a Reply